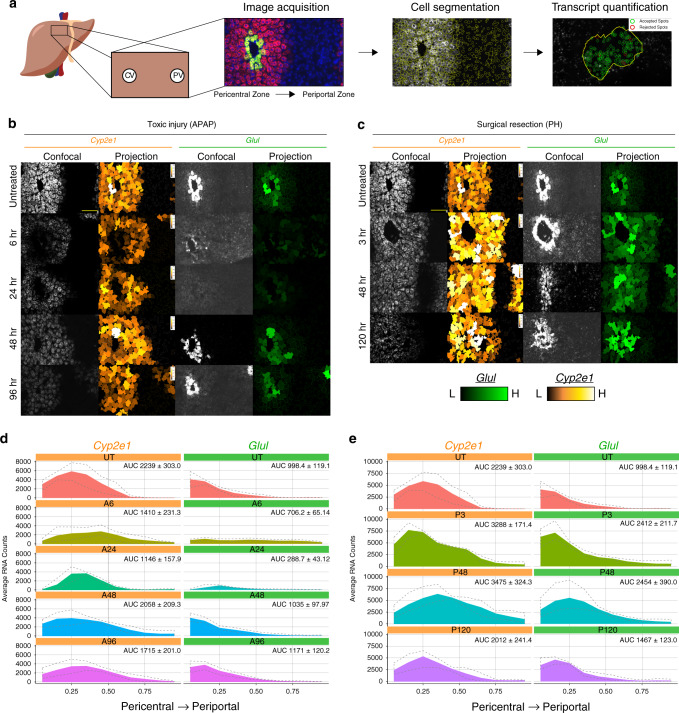
Fig. 2. Functional compensation of hepatocytes following acute liver injury.
a Schematic for staining and image quantification. b, c Images of liver section showing pericentral markers Cyp2e1 and Glul for untreated and each APAP-treated (b) or PH-treated (c) time point (left column). Cell outlined and colored by number of Cyp2e1 transcripts (brown, low; white, high) for each condition (middle column). Cell outlined and colored by number of Glul transcripts (black, low; bright green, high) for each condition (right column). Scale bars are 100 μm. d, e Quantification of gene expression intensity across the lobule for Cyp2e1 and Glul. 90% of area under the curve (AUC) for UT is to the left dashed red line. treated (d) and PH-treated (e). Source data provided as a Source Data file.

