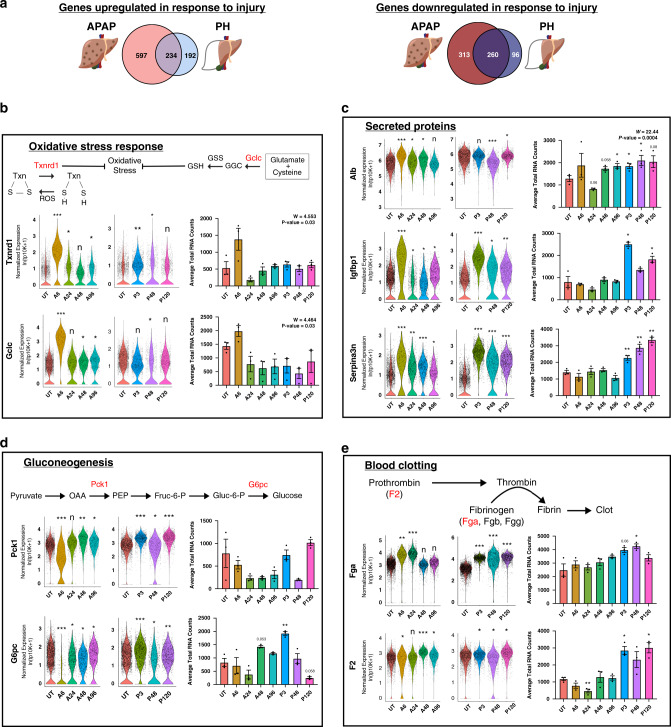
Fig. 3. Shared and unique gene expression responses in acute liver injury models.
a Venn diagram showing genes significantly changed in response to APAP and/or PH treatment compared to untreated. b Expression of oxidative stress response genes (Txnrd1 and Gclc) significantly upregulated in APAP treatment response. c–e Expression of genes representing specific hepatic functions (c, secreted proteins; d, gluconeogenesis; e, blood clotting). scRNA-seq data (left) presented as violin plots. smFISH quantification (right) shown as bar plot with individual replicates presented as dots (n = 3). Error bars are s.e.m., P < 0.05 (*), < 0.005 (**), < 0.0005 (***), and < 0.0001 (****) calculated using unpaired t tests with Welch’s correction (two-tailed) comparing untreated group (UT) to all other experimental groups. Source data provided as a Source Data file.

