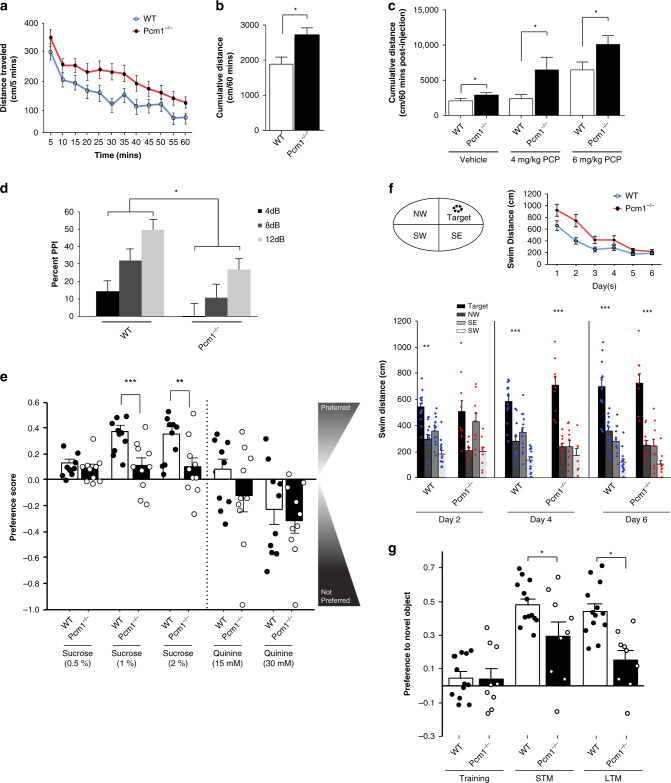
Fig. 2. Behavioral defects in adult Pcm1−/− mice.
a Spontaneous activity in the open field at 5 min intervals over 60 min. b Cumulative distance travelled in the open field. (a–b, N = 21 WT, N = 30 Pcm1−/−; p < 0.001 (time), p = 0.04 (genotype)). c Locomotor responses to PCP in the open field as cumulative distance travelled (N = 11 and 18 mice/genotype/treatment condition; p = 0.04). d Prepulse inhibition to the 4, 8, and 12 decibel (dB) prepulses (N = 11 and 12 mice/genotype; p = 0.006 (genotype), p < 0.001(PPI), p = 0.013 (genotype)). e Anhedonia-like responses in Pcm1−/− mice as determined in a two-bottle sucrose preference test with different concentrations of sucrose. Because responses to quinine were not distinguished by genotype, gustatory responses appeared similar in the two groups (N = 10 mice/genotype/repeated test condition; p = 0.002 (1% sucrose), p = 0.013 (2% sucrose)); overall effect of quinine concentration with all mice consuming less of the 30 mM quinine compared to water alone (p = 0.015); overall drinking volumes did not differ between genotypes and test conditions (range 8–10 ml/night/mouse). f Morris water maze performance showing the location of the hidden platform (Target) in the northeast (NE quadrant), as well as acquisition learning and probe trial performance. For acquisition an overall genotype effect for swim distance was found, p = 0.035. Probe trials showing swim distance in each quadrant, NE (Target), NW = northwest, SE = southeast, and SW = southwest quadrants. For probe tests significance denoted for target relative to remaining quadrants (N = 10 and 14 mice/genotype; within subjects contrast Probe Day × Genotype × Quadrant (quadratic), p = 0.004. No genotype differences detected. g Novel object recognition memory performance showing preference for the novel or familiar objects at training and on tests for short-term (STM) and long-term memory (LTM) (N = 9 and 13 mice/genotype; RMANOVA Test Day × Genotype p = 0.022). Data presented as means ± SEM; behavioral data analyzed by t-tests, ANOVA, or repeated measures ANOVA with Bonferroni corrected post-hoc tests. *p < 0.05; **p < 0.01, ***p < 0.001, WT vs. Pcm1−/−. Source data and detailed statistical information are provided as a Source Data File.

