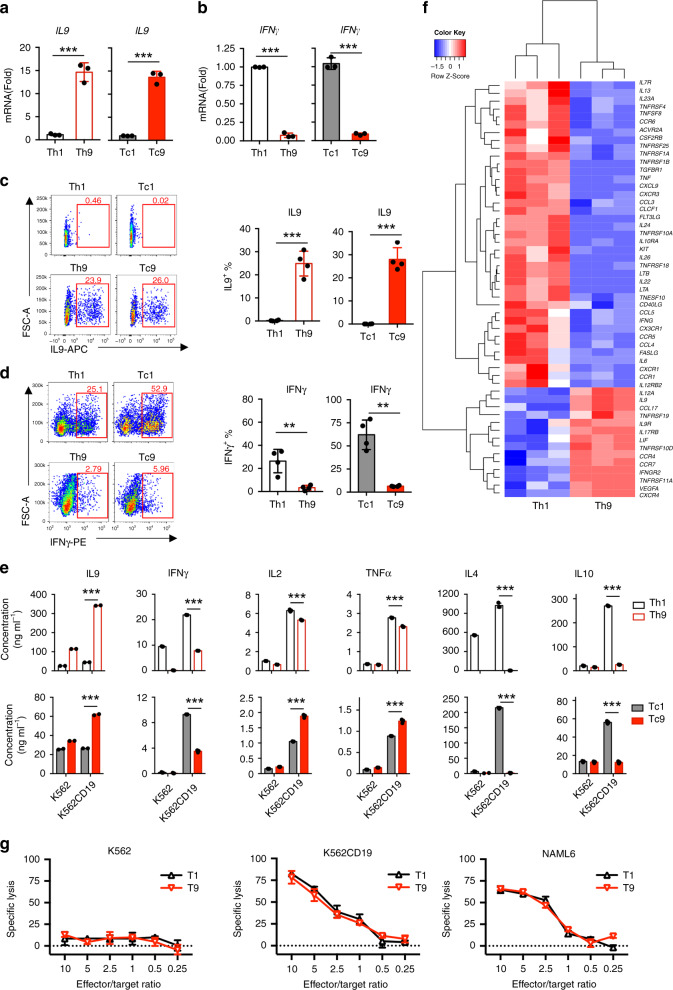
Fig. 1. Characterization of T9 CAR-T cell cytokine expression profiles.
CAR-T cells were harvested and analyzed at day 16 during in vitro expansion. Real-time PCR analysis of relative mRNA expression of a IL9 (n = 4 donors) or b (n = 4 donors) IFN-γ in sorted CD4+ and CD8+ CAR-T cells. c Representative flow plots (left panels) and summarized data (right panels; n = 4 donors) showing IL9 expression in CAR-T cells. Cells were pre-gated for GFP+CD3+CD8+ or GFP+CD3+CD4+ T cells. d Representative flow plots (left panels) and summarized data (right panels; n = 4 donors) showing IFN-γ expression in CAR-T cells. Cells were pre-gated for GFP+CD3+CD8+ or GFP+CD3+CD4+ T cells. e Concentrations of secreted cytokines by sorted Th1 or Th9 (upper panels), or Tc1 or Tc9 (lower panels) CAR-T cells in response to K562 or CD19-expressing K562 (K562-CD19) tumor cells. Production of indicated cytokines was determined by BD Cytometric Bead Assay kit (n = 3 donors). f Heatmap illustrating the relative expression of cytokines and cytokine receptors by in vitro polarized Th9 or Th1 CAR-T cells. RNA of purified CD4+ GFP+ CAR-T cells was extracted for RNASeq. g Percentage of specific lysis of CAR-T cells against target tumor cells at indicated E:T ratios determined by luciferase assay at 24 h culture. Experiments were performed with three biological replicates and data shown are representative of three independent experiments. Data are presented as mean ± SD (*P < 0.05, **P < 0.01, and ***P < 0.001, two-sided Student’s t-test). Source data are provided as a Source Data file.

