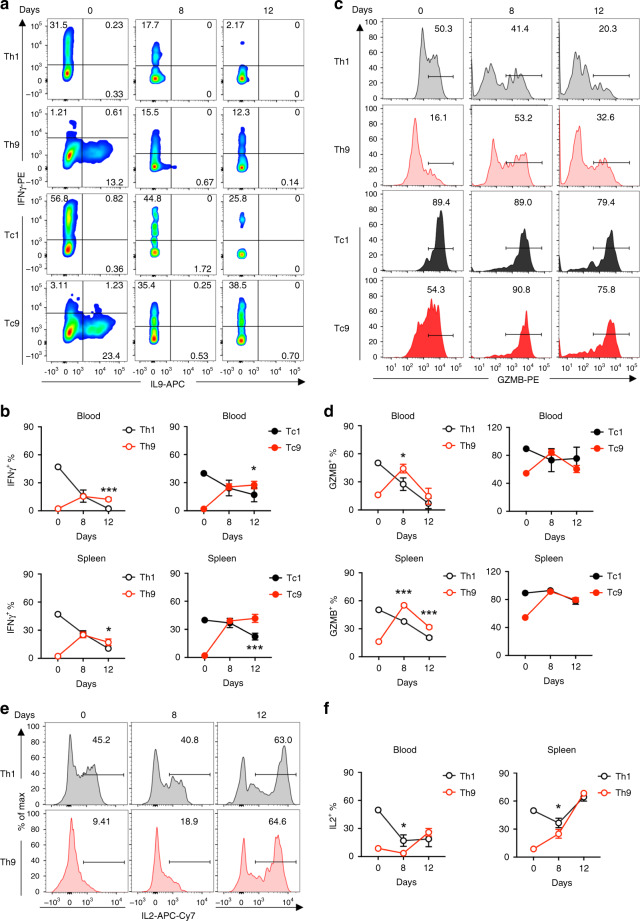
Fig. 5. T9 CAR-T cells acquire effector function in vivo after transfer.
a Representative flow plots showing the percentages of IFN-γ-expressing and IL9-expressing CD4+ (Th1 or Th9) and CD8+ (Tc1 or Tc9) CAR-T cells from spleen of treated mice at day 8 after transfer. b Summarized data (n = 5 mice) showing the frequency of IFN-γ-expressing CD4+ (Th1 or Th9; left panels) and CD8+ (Tc1 or Tc9; right panels) CAR-T cells in peripheral blood (upper panels) or spleen (lower panels) of treated mice at days 8 and 12 after transfer. c Representative flow plots showing the percentage of GrzB-expressing CD4+ (Th1 or Th9) and CD8+ (Tc1 or Tc9) CAR-T cells from spleen of treated mice at days 8 and 12 after transfer. d Summarized data (n = 5 mice) showing the frequency of GrzB-expressing CD4+ (Th1 or Th9; left panels) and CD8+ (Tc1 or Tc9; right panels) CAR-T cells in peripheral blood (upper panels) or spleen (lower panels) of treated mice at days 8 and 12 after transfer. e Representative flow plots showing the percentage of IL2-expressing CD4+ CAR-T cells from spleen of treated mice at days 8 and 12 after transfer. f Summarized data (n = 5 mice) showing the frequency of IL2-expressing CD4+ CAR-T cells in peripheral blood and spleen of treated mice at days 8 and 12 after transfer. Data are presented as mean ± SD. *P < 0.05 and ***P < 0.001, two-sided Student’s t-test. Source data are provided as a Source Data file.

