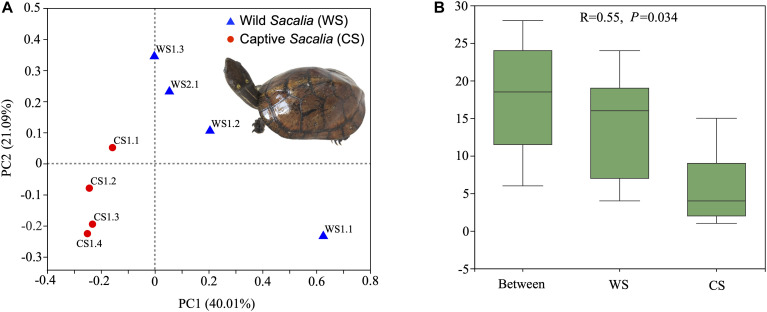
FIGURE 1.
Beta diversity and ANOSIM analyses. (A) Principal Coordinates Analysis (PCoA) plot of beta diversity based on unweighted UniFrac distances for bacterial communities in fecal samples of eight Beal’s eyed turtles (Sacalia bealei). The main coordinates (PC1 and PC2) are represented in the axes, and their relative contributions are denoted by the percentage in parentheses. (B) ANOSIM analysis. R-value range (–1, 1). An R-value close to 0 represents no significant differences in inter-group and intra-group. An R-value close to 1 shows that inter-group differences are greater than intra-group differences. The P-value represents the confidence level of the statistical analysis; P < 0.05 reflects a statistically significant difference. The y-axis represents the distance rank between samples, and the x-axis represents the results between both groups. Intra-group results are shown for each group.

