FIGURE 3.
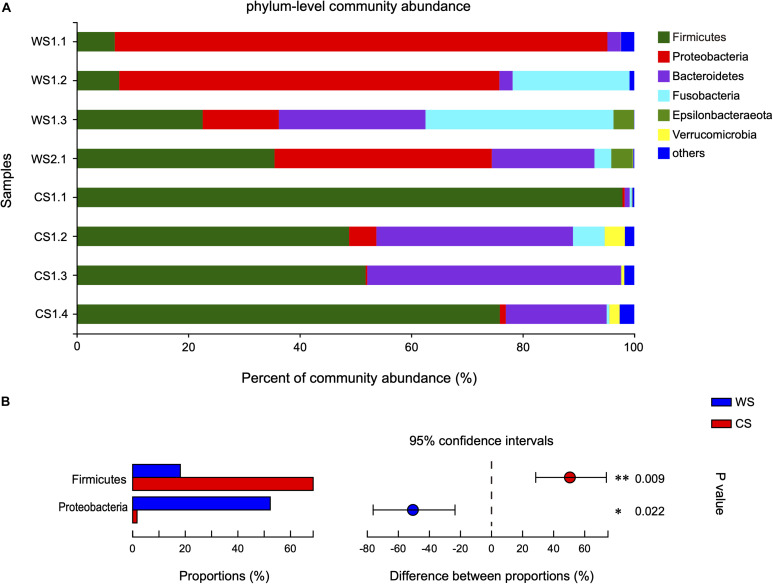
Comparison of bacterial community at the phylum level in wild and captive Sacalia bealei. (A) Barplots of community abundance. Taxa with abundances <2% have been combined under “others.” (B) The significant phylum in the abundances >2%. The phyla significantly different between groups are indicated (*P < 0.05, **P < 0.01). P-values are based on Wilcoxon rank-sum test or Student’s t-tests, depending on the distribution of the data. WS = Wild Sacalia, CS = Captive Sacalia.

