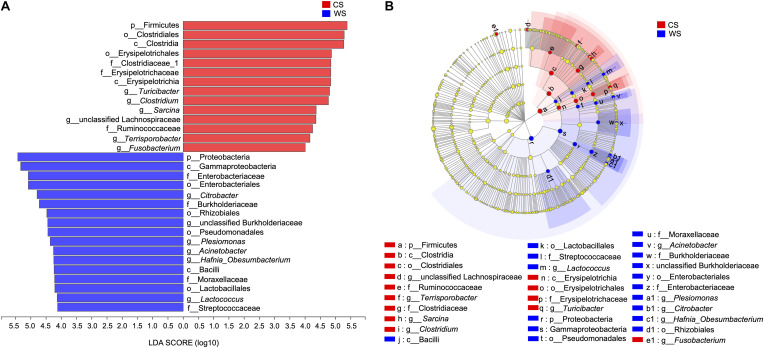
FIGURE 6.
Linear discriminant analysis effect size (LEfSe) (A), The bar graph of LDA scores showing the taxa with statistics difference between wild (WS) and captive (CS) Sacalia. The degree of influence of a species was expressed by the length of the bar. Only taxa meeting an LDA significant threshold >4 are shown. (B) The cladogram of taxa showing significant difference between groups. Red and green dots represent the core bacterial populations in WS and CS, respectively.

