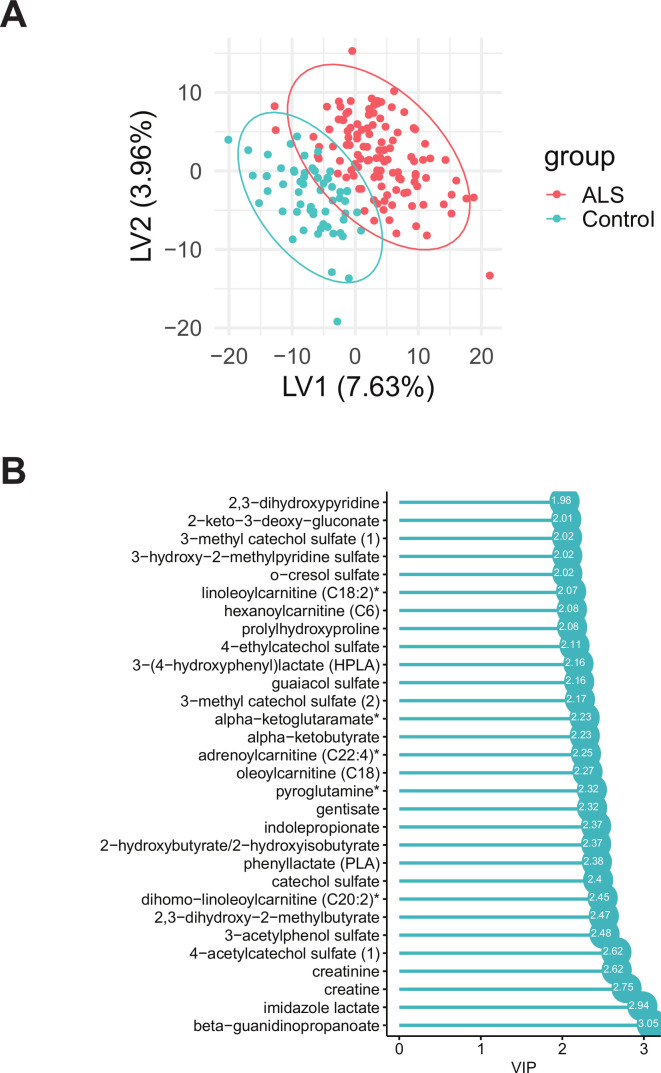
Figure 1.
Partial least squares-discriminant analysis (PLS-DA) analysis of amyotrophic lateral sclerosis (ALS) cases versus controls. (A) PLS-DA score plot of ALS cases (red) versus controls (blue); each dot represents an individual subject. (B) The variable importance in projection (VIP) score plot of the top 30 PLS-DA metabolites, which most significantly separate cases from controls. A total of 295 metabolites had VIP >1. Asterisks denote compounds that have not been confirmed against a standard, but whose identity the analytical platform is confident in.

