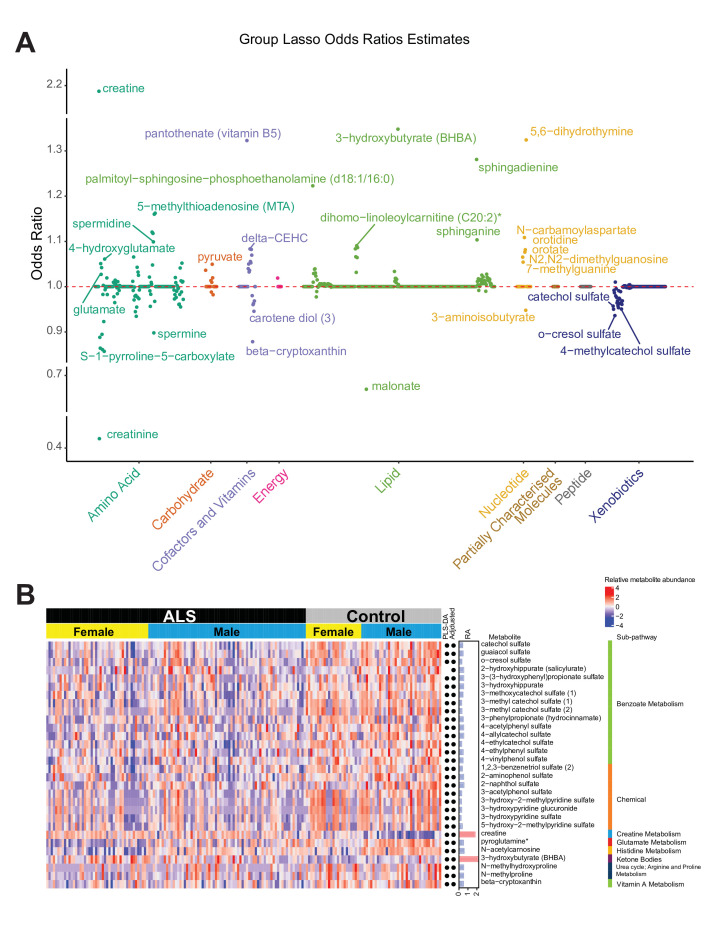
Figure 2.
Group lasso of amyotrophic lateral sclerosis (ALS) cases versus controls. (A) The ORs of each metabolite within its respective super-pathway. The dashed red line represents an OR of 1. All OR values are available in online supplemental table S4. (B) A heatmap of relative levels for the 30 metabolites with the highest differences in relative abundance in cases versus controls. Metabolites selected by partial least squares-discriminant analysis and adjusted models are marked by a black dot next to the differences in relative abundance (RA) column. Pink bars, OR >1, RA >0 (over-represented metabolites); blue bars, OR <1, RA <0 (under-represented metabolites). A heatmap of all metabolites is available in online supplemental figure S8. Asterisks denote compounds that have not been confirmed against a standard, but whose identity the analytical platform is confident in.

