Figure 4.
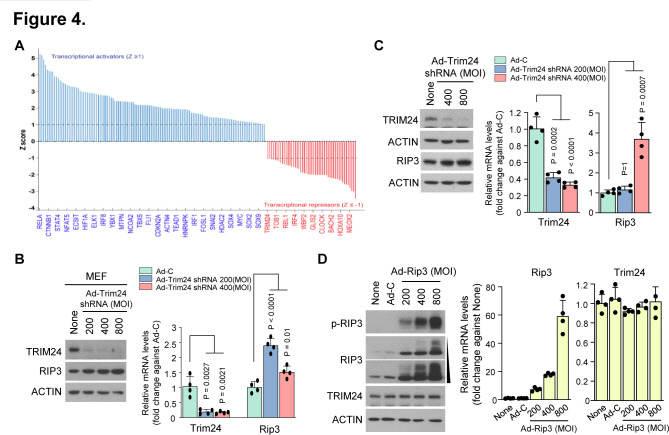
RIP3 overexpression alters gene expression patterns via the negative regulator TRIM24. (A) Transcriptional regulators were analysed by Ingenuity Pathway Analysis (IPA) software (QIAGEN, https://www.qiagenbioinformatics.com/products/ingenuitypathway-analysis) to predict upstream regulators based on microarray data. Analysed data were filtered by activation Z-score >1 or <-1, and regulators were not required to be expressed in the samples analysed. (B) Mouse embryonic fibroblasts (MEFs) and (C) chondrocytes were infected with Ad-C or Ad-Trim24 shRNA at the indicated multiplicity of infection (MOI). Cell lysates were analysed by western blotting (left) (n=3) and quantitative PCR (qPCR) (right) (n=4). (D) Western blot analysis of RIP3, p-RIP3 and TRIM24 in chondrocytes infected with Ad-C or Ad-Rip3 (left) (n=3). qPCR analysis of Rip3 and Trim24 in chondrocytes infected with Ad-C or Ad-Rip3 (right) (n=4). Values are expressed as the mean±SEM. Statistical analyses were performed using two-tailed t-tests.

