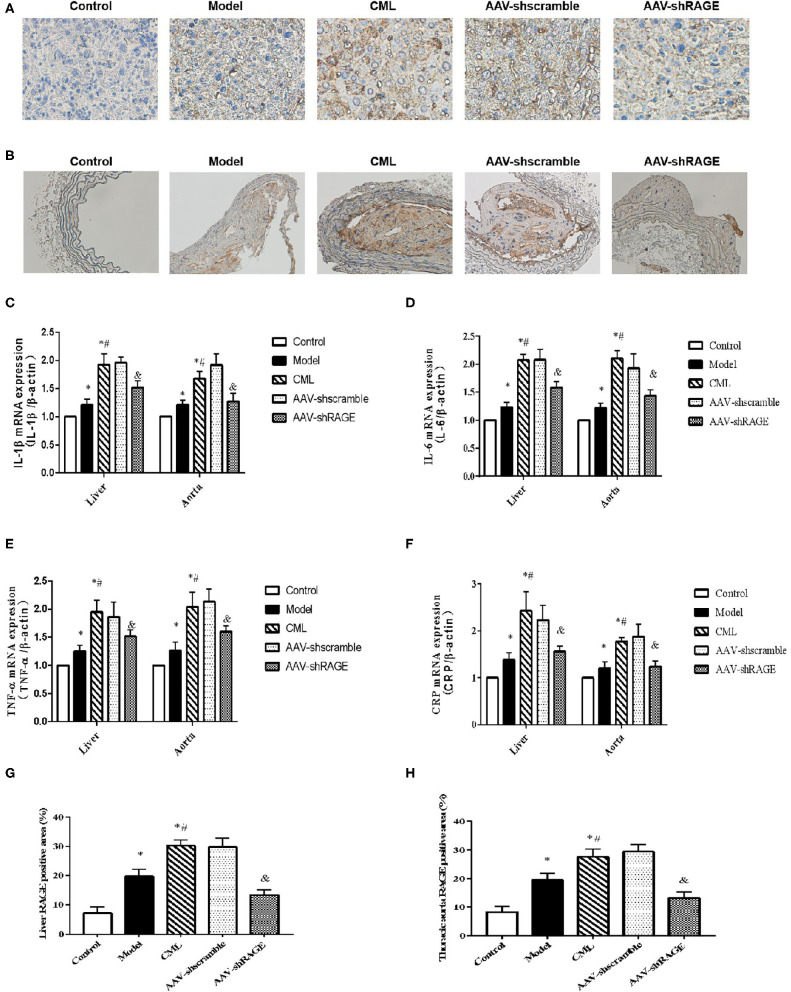
Figure 8.
After AAV injection, the expression of RAGE in liver and aorta changed (A) and (B) Immunohistochemistry shows the expression of RAGE (×400). (C–F) Detection of IL-1β, IL-6, TNF-α, CRP mRNA expression levels in liver and aorta by PCR (G,H) Percentage of RAGE positive immunohistochemical staining area. The proportion of the positive area to the total Liver area was calculated by ImageJ. *P < 0.05, compared with normal control group; #P < 0.05, compared with model group;&P < 0.05, compared with CML group.

