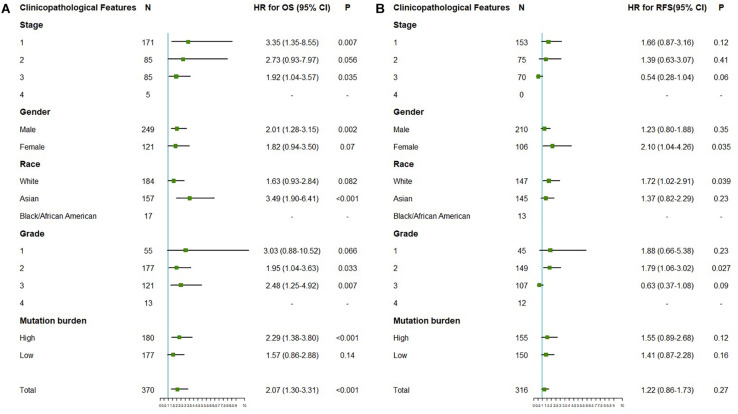
FIGURE 3.
The correlation between the expression of OTUB1 mRNA and OS (n = 370, A), PFS (n = 316, B) in LIHC. The analysis was stratified by different clinicopathological features. Green squares represent HR. LIHC, liver hepatocellular carcinomas; HR, hazard ratio; OS, overall survival; RFS, relapse-free survival.

