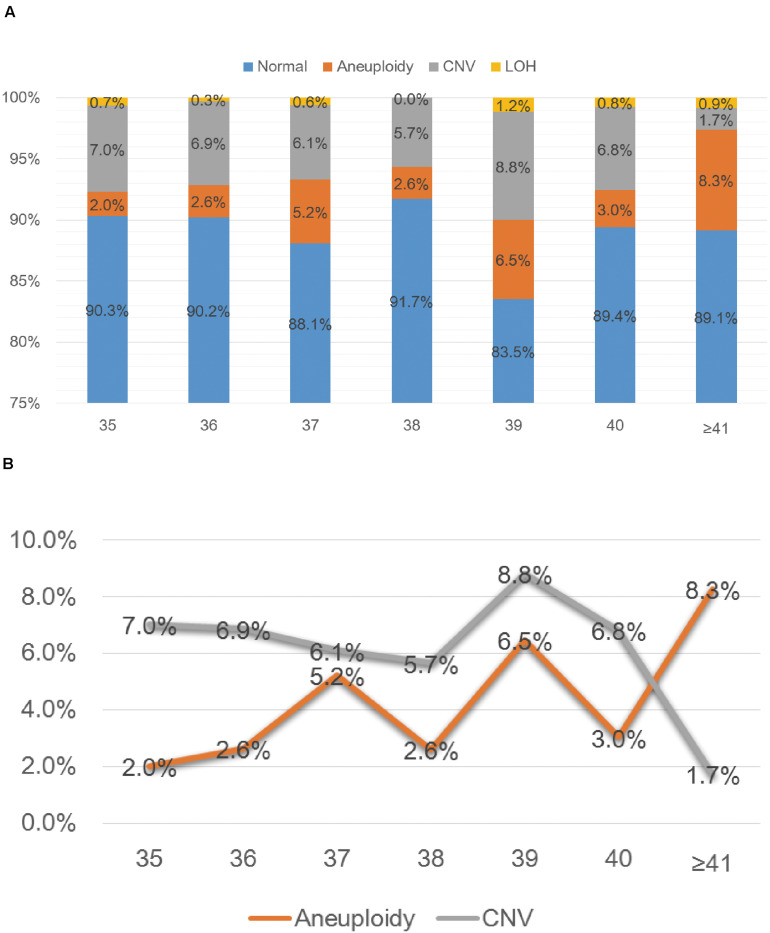
FIGURE 2.
SNP-array results of 1784 samples with advanced maternal age (A) and the relationship between age and chromosomal abnormality rate (B). (A) The percentage of cases with normal results, aneuploidy, CNV and LOH in seven subgroups of different age. (B) The percentage of cases with aneuploidy and CNV according to maternal age.

