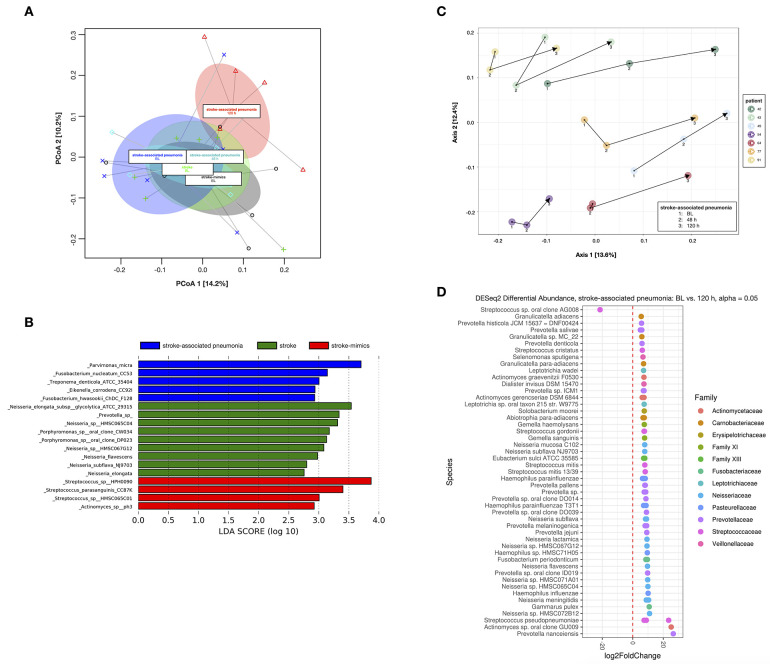
Figure 3.
Beta diversity analysis from 16S rRNA amplicon sequencing. (A) Principal coordinate analysis (PCoA) of weighted UniFrac distances for analyzed samples from stroke mimics and stroke patients at baseline (BL) as well as for stroke-associated pneumonia patients at BL and at 48 and 120 h after BL. Ellipses indicate the 95% confidence interval of group centroids. (B) Discriminatory operational taxonomic units (OTUs) for stroke mimics, stroke patients, and stroke-associated pneumonia patients at BL, as revealed from linear discriminant analysis (LDA) effect size (LEfSe) analysis. (C) PCoA of unweighted UniFrac distances for the stroke-associated pneumonia patients over time at BL and at 48 and 120 h after BL (indicated by arrows for each individual patient). (D) Significantly differentially abundant OTUs in stroke-associated pneumonia patients between BL and 120 h after BL, as detected by DESeq2.

