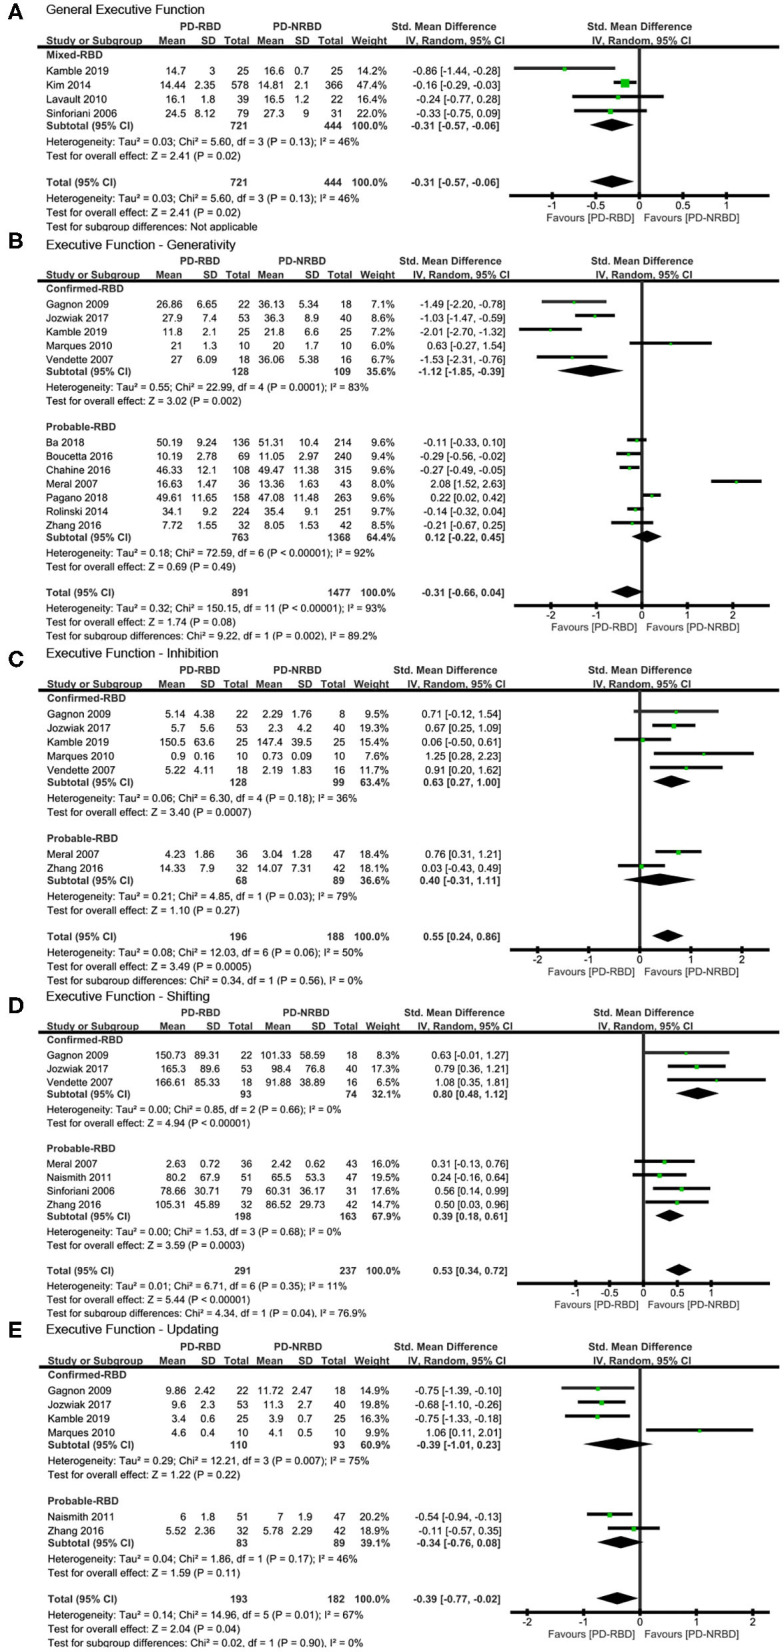
Figure 4.

Forest plot for (A) general executive function (EF), (B) generativity with subtotals by the diagnosis of rapid eye movement sleep behavior disorder (RBD), (C) inhibition with subtotals by the diagnosis of RBD, (D) shifting with subtotals by the diagnosis of RBD, and (E) updating with subtotals by the diagnosis of RBD displaying effect size calculated using a random-effects model. SD, standard deviation; Std. Mean Difference, standardized mean difference; CI, confidence interval.
