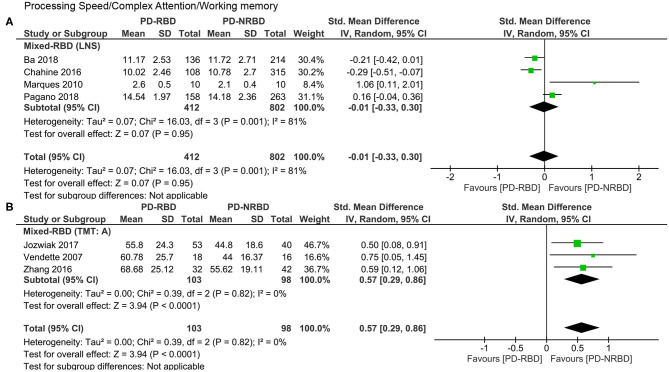
Figure 6.
Forest plot for processing speed/complex attention/working memory evaluated by the (A) LNS and the (B) TMT: A displaying effect size calculated using a random-effects model. SD, standard deviation; Std. Mean Difference, standardized mean difference; CI, confidence interval; LNS, letter–number sequence; TMT: A, trail making test, part A.

