
Figure 1.
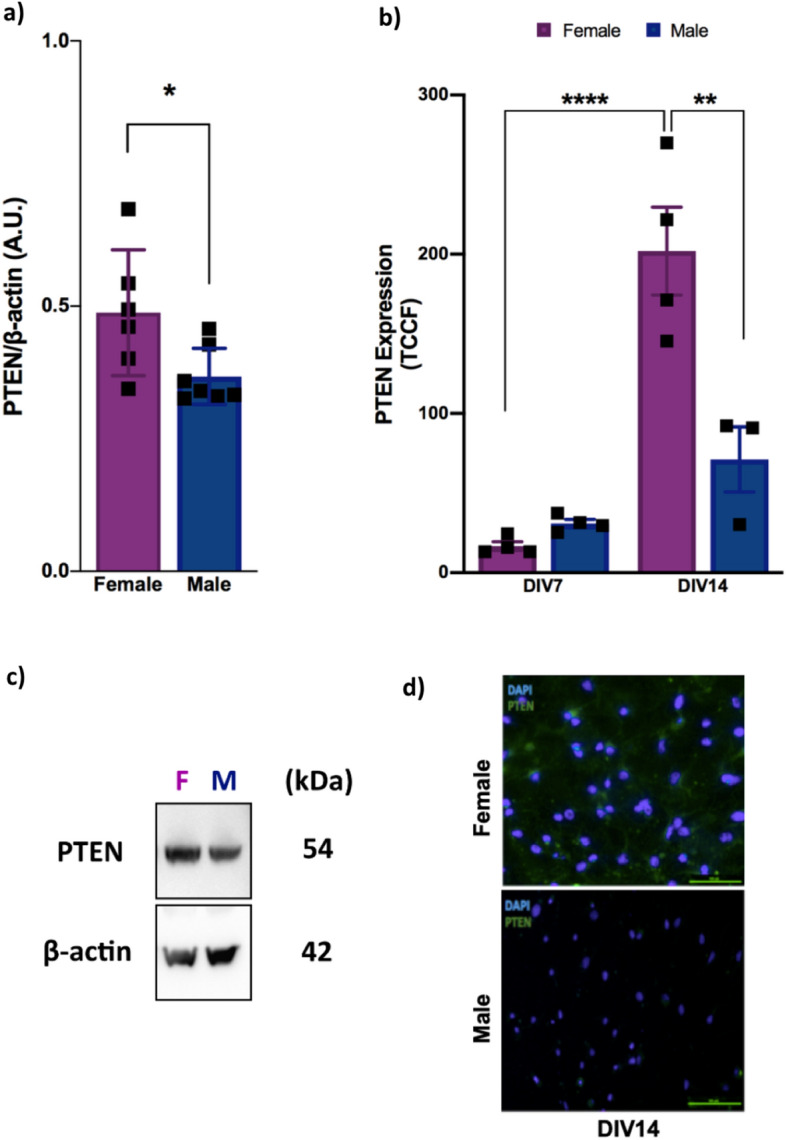
Female mice express higher levels of PTEN protein in the brain than males. (a) Cortical PTEN protein expression in 2-month-old female and male wild-type mice as analyzed by western blotting [n = 7 (male) and n = 6 (female); *P = 0.0335, #q = 0.0410; two-tailed Student’s t-test], (b) embryonic cortical neurons from male and female wild-type embryos 7 days in vitro (7 DIV) and 14 days in vitro (14 DIV) as analyzed by immunofluorescence [(n = 4 (male and female); each time, 50 cells of each embryo were counted; ****P < 0.0001; **P = 0.0014); two-way ANOVA followed by Tukey’s post hoc test. (c) Representative image of PTEN and β-actin bands in male and female adult mice. (d) Representative images of PTEN staining of male and female mice 14 DIV (scale bar, 100 µm; 20× magnification). All results are expressed as the means ± S.E.M. *P < 0.05, **P < 0.01, ****P < 0.0001. Full-length blots are provided in Supplementary Fig. S1. Multiple t tests comparisons were corrected by controlling FDR. The summary with all statistical analyses are provided in Supplementary Material Table 1.