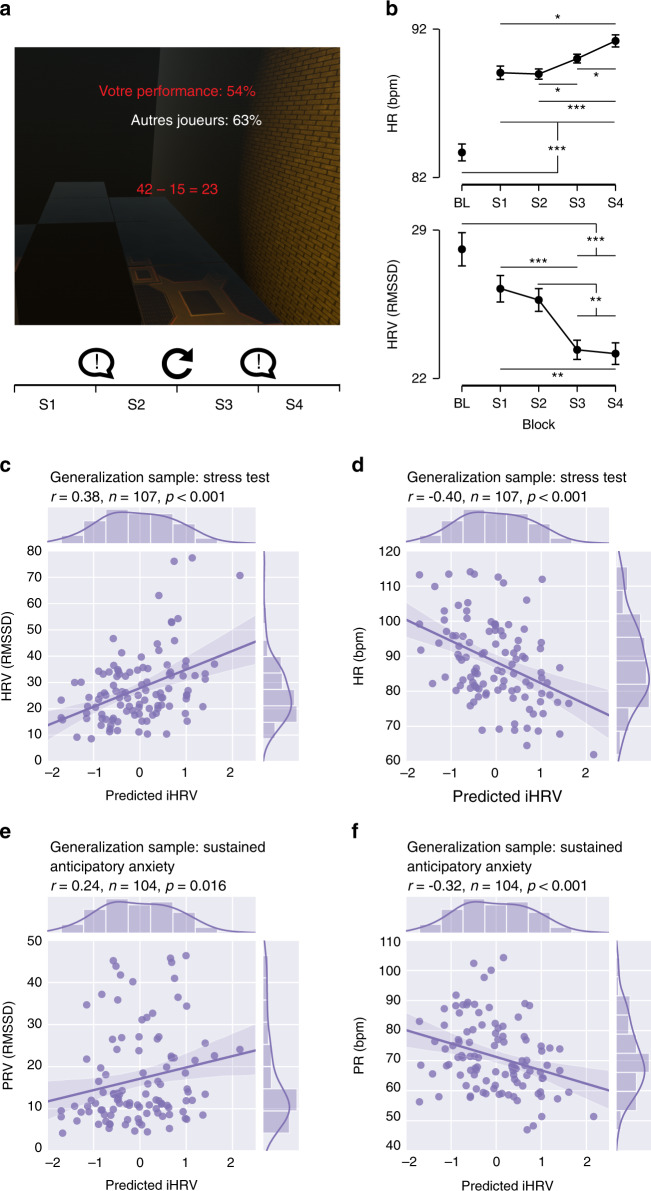
Fig. 4. Generalization of model prediction of iHRV to other stressful or anxiogenic situations and a generalization subsample.
a Schematic of a virtual reality stress test involving mental arithmetic and challenging contextual navigation. This scenario lasts 10 min and is split into 2.5-minute segments (S1–S4). After segments S1, S2, and S3, participants are presented with a prerecorded voice asking them to perform better. b Physiological (HR, HRV) responses to the stress induction task. During segment BL, baseline recordings are taken. N = 99 participants examined over five blocks of 2.5 min (Bl, S1, S2, S3, and S4). Data are presented as mean values ±SEM (vertical lines). A repeated measures analysis of variance (rm-ANOVA) was performed for HR and to HRV. Post hoc tests were performed with two-sided paired t tests, with p values corrected for multiple comparisons (10 comparisons) with the Holm correction. *p value < 0.05, **p value < 0.01, ***p < 0.001. Exact p values and statistics are presented in Supplementary Information section “Statistics for physiology in Fig. 4b“, Tables S13–14. c Spearman correlations (two-tailed p = 5.258e-5) between the model predictions for iHRV and HRV for the sample of participants who underwent the stress task. d Spearman correlation (two-tailed p = 2.523e-5) between the model predictions for iHRV and HR for the sample of participants who underwent the stress task. e Spearman correlation (two-tailed p = 0.016) between the model predictions for iHRV and pulse rate variability (PRV) for the sample of participants in the fear anticipation condition. f Spearman correlation (two-tailed p = 9.739e-4) between the predicted value of iHRV and pulse rate (PR) for the sample of participants in the fear anticipation condition. 95% confidence interval for the regression lines drawn using translucent bands.

