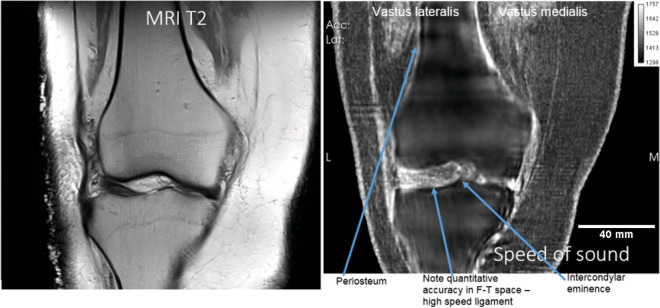
Figure 2.
Showing correlation of speed of sound (right) and MR images (left) for the coronal view of the cadaver knee for T2 weighted MR image on the left versus SOS image on the right. Note the periosteum has the correct high speed and is clear on the QT ultrasound SOS image (right) whereas it does not generate a signal in the MR image (left panel). The lateral collateral ligament is likewise visible with correct SoS on the right but does not generate a signal in the MR image (left).

