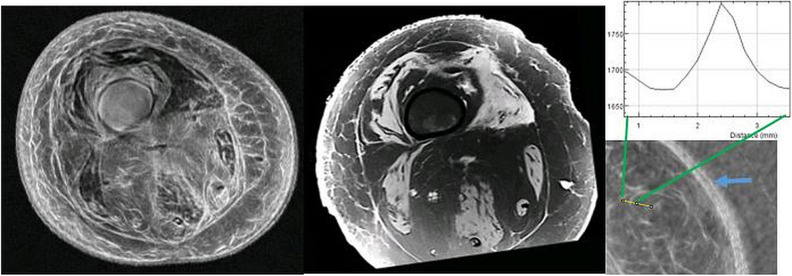
Figure 8.
Left panel is speed of sound (inverted grayscale) fused with reflection image (axial). Middle panel is MR image (axial). A direct correspondence is seen between the vastus lateralis and vastus medialis muscle groups between the two images. The Sartorius, semimembranosus, biceps femoris muscles are seen to correspond in both images. The gray-scale is inverted for the SOS fused image on the left so the muscle groups appear dark in this image. The QTUS shows more detail than other color schemes due to highlighting of connective tissue. A close up of a fused QTUS knee image (axial) on the right shows also a cross-section (yellow bar), showing the thickness of connective tissue is 0.6 mm full-width half max (FWHM). Notice also the complete separation between dermis, epidermis, hypodermis in the right panel closeup. (blue arrow).

