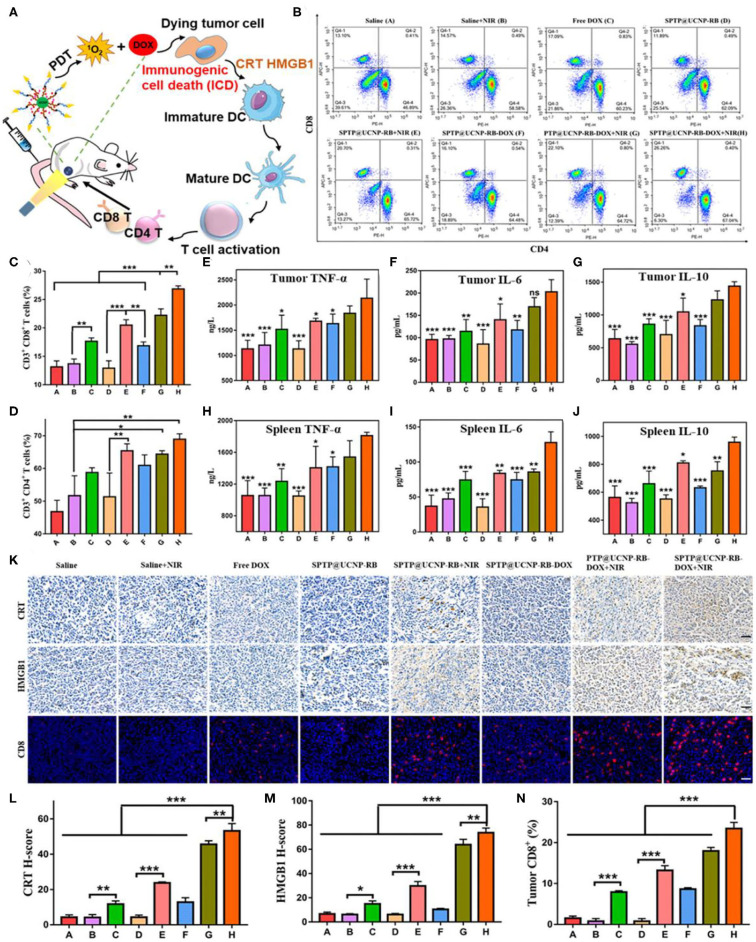
Figure 4.
Detection of antitumor immunity in vivo. (A) Illustration of the ICD-associated DAMP process. (B–D) Flow cytometry analysis of CD4+ T cells (CD3+ CD4+) and CD8+ T cells (CD3+ CD8+) proliferation in spleen tissues collected from all mice groups. (E–G) Quantitative analysis of TNF-α, IL-6, and IL-10 from tumor lysis solution and (H–J) in spleen lysis solution by the Elisa kit. Symbols on columns represent statistic difference vs. the SPTP@UCNP-RB-DOX + NIR group (n = 6). (K) CRT exposure and HMGB1 secretion in tumor tissues were observed by immunohistochemistry. The infiltration of immune cells in tumors was detected by immunofluorescence dyeing of CD8 T cells (scale bar = 20 μm). (L–N) Quantitative analysis of CRT exposure, HMGB1 secretion, and CD8 infiltration in tumor tissues by image J. *p < 0.05; **p < 0.01; ***p < 0.001. Copyright 2020, American Chemical Society (Jin et al., 2020).

