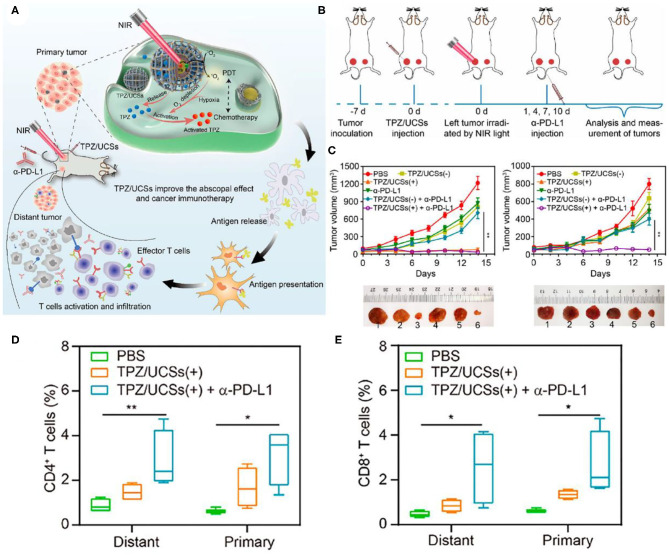
Figure 9.
(A) Schematic illustration of the structure of TPZ/UCSs and their application to tumor treatment through a combination of NIR light-triggered PDT and hypoxia-activated chemotherapy with immunotherapy. (B) Schematic illustration of NIR light-triggered combinational therapy. (C) Growth curves of primary tumors (left) and distant tumors (right) in CT26 tumor-bearing mice after different treatments. Photographs of primary tumors and distant tumors collected from mice 14 days after treatments: (1) PBS, (2) TPZ/UCSs(–), (3) TPZ/ UCSs(+), (4) α-PD-L1, (5) TPZ/UCSs(–) + α-PD-L1, and (6) TPZ/UCSs(+) + α-PD-L1. Percentage of tumor-infiltrating (D) CD4+ T cells, (E) CD8+ T cells in total tumor cells. Data are means ± SD; N = 4. *P < 0.05, **P < 0.01. Copyright 2020, American Chemical Society (Shao et al., 2020).

