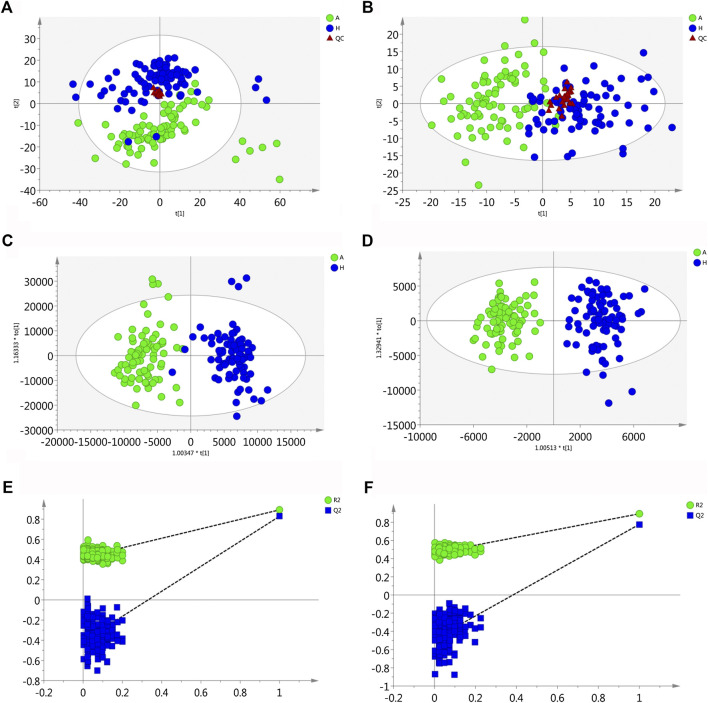
FIGURE 1.
Multivariate statistical analysis of two groups. The principal component analysis (PCA) plot of QC and samples in (A) positive ion mode and (B) negative ion mode in the training set. The orthogonal partial least square discrimination analysis (OPLS-DA) score plots of OLP group vs. healthy control group in (C) positive ion mode and (D) negative ion mode in the training set. Cross-validation plot with a permutation test repeated 200 times of OLP group vs. healthy group in (E) positive ion mode and (F) negative ion mode in the training set. A, OLP group; H, healthy control; QC, quality control.

