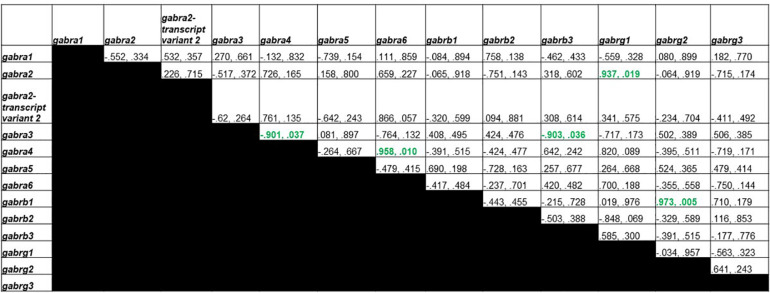
FIGURE 6.
Pearson Correlations for GDX group GABAA receptor subunit gene expression. Data are presented as R and p. R is the correlation coefficient, and p is the p-value from student’s t-test. 5 significant correlations were found between Gabra3 and Gabra4, Gabra4 and Gabra6, Gabra3 and Gabrb3, Gabra2 and Gabrg1, and Gabrb1 and Gabrg2.

