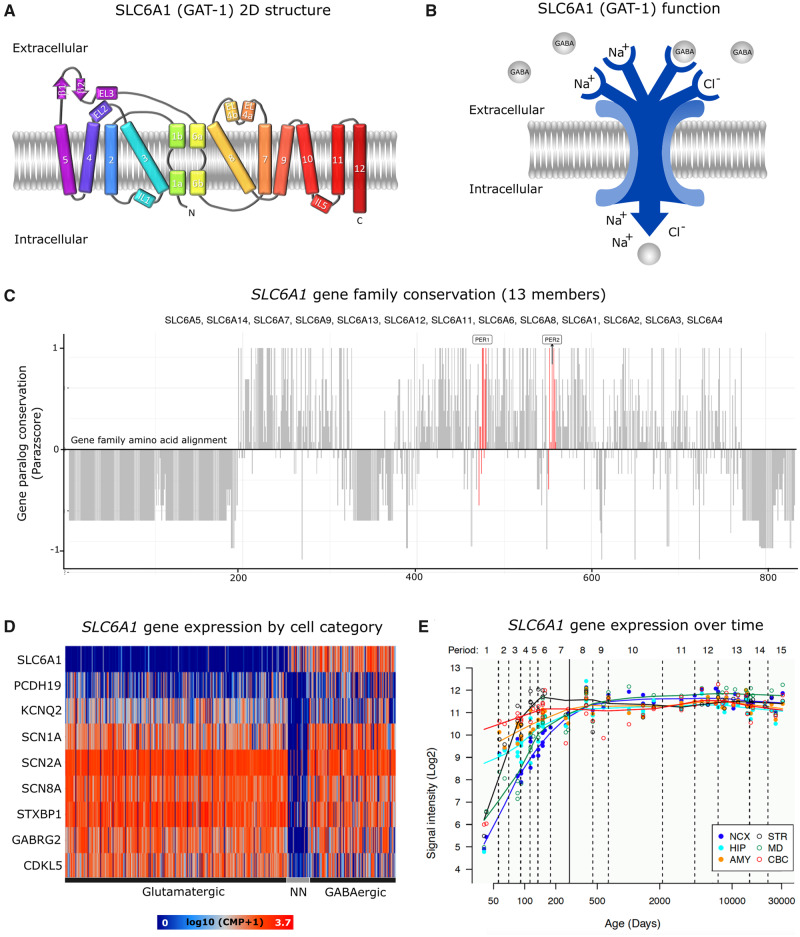
Figure 1.
SLC6A1 main features. (A) Schematic representation of the 2D structure of GAT1. (B) Diagram of GAT1 GABA transport function. (C) Paralogue conservation of the SLC6A1 gene family members. Higher values denote the degree of conservation. The pathogenic enriched regions are shown in red bars. (D) Cell type-specific expression of SLC6A1 and other frequently mutated epilepsy and neurodevelopmental disorder-associated genes (http://celltypes.brain-map.org/rnaseq/human). (E) Dynamic gene expression of SLC6A1 along with entire development and adulthood in the cerebellar cortex (CBC), mediodorsal nucleus of the thalamus (MD), striatum (STR), amygdala (AMY), hippocampus (HIP) and 11 areas of the neocortex (NCX) (http://hbatlas.org).

