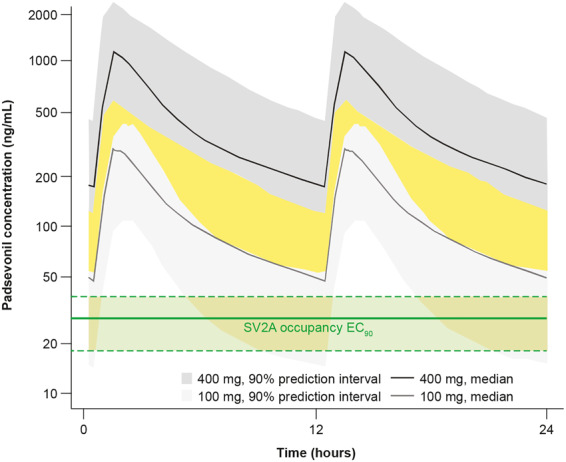
Figure 4.

Population pharmacokinetic and receptor occupancy modelling. Estimated PSL concentration leading to 90% SV2A occupancy (median EC90 and 90% confidence interval as shown in the green-shaded area) compared with simulated PSL steady state plasma concentrations following 100 and 400 mg twice daily dosing (median and 90% predicted interval describing the inter-patient variability as shown in areas shaded light and dark grey, respectively). Given the variability in PSL pharmacokinetics following 100 and 400 mg twice daily dosing, some overlap is expected (represented by the yellow-shaded area). (EC90 = concentration producing 90% of maximum effect).
