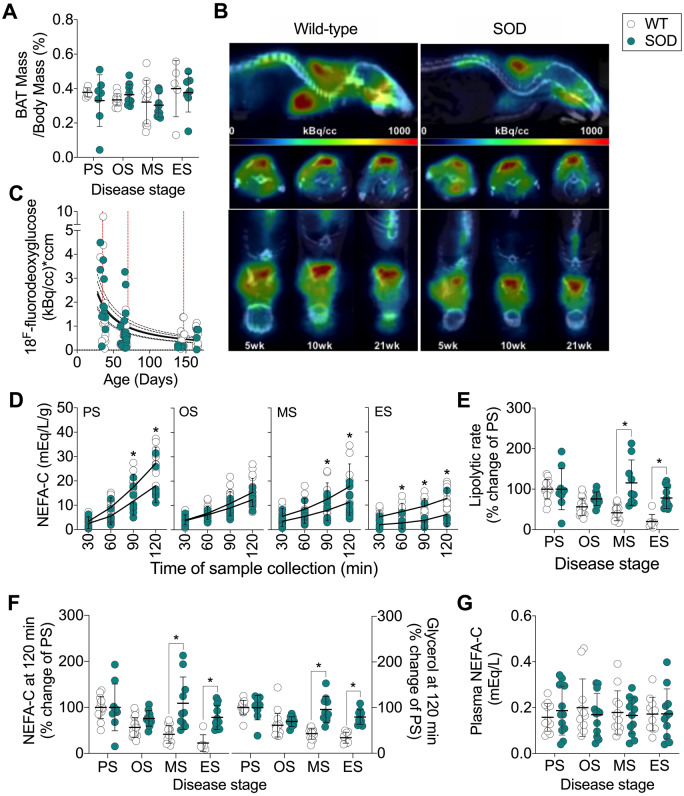
Figure 3.
Lipolysis is maintained throughout disease course in SOD1G93A mice. (A) BAT weight (n = 5–12/group) and (B, C) glucose uptake in BAT in SOD1G93A mice and age-matched WT controls (n = 9–11/group). (D) Levels of NEFA-C in Krebs–Henseleit buffer as an indicator of lipolytic rate of epididymal white adipose tissue explants from SOD1G93A mice and WT controls (n = 6–17/group). (E) Lipolytic rate expressed as a per cent of that observed at PS stage. (F) Cumulative NEFA (n = 6–17/group) and glycerol (n = 8–17/group) in Krebs–Henseleit buffer. (G) Circulating plasma NEFA in SOD1G93A mice and WT age-matched controls (n = 12/group). White circles represent WT mice; teal circles represent SOD1G93A transgenic mice. All data presented as mean ± SD. *P < 0.05, two-way ANOVA with Bonferroni’s post hoc test. ES = end-stage; MS = mid-stage; OS = onset; PS = presymptomatic.

