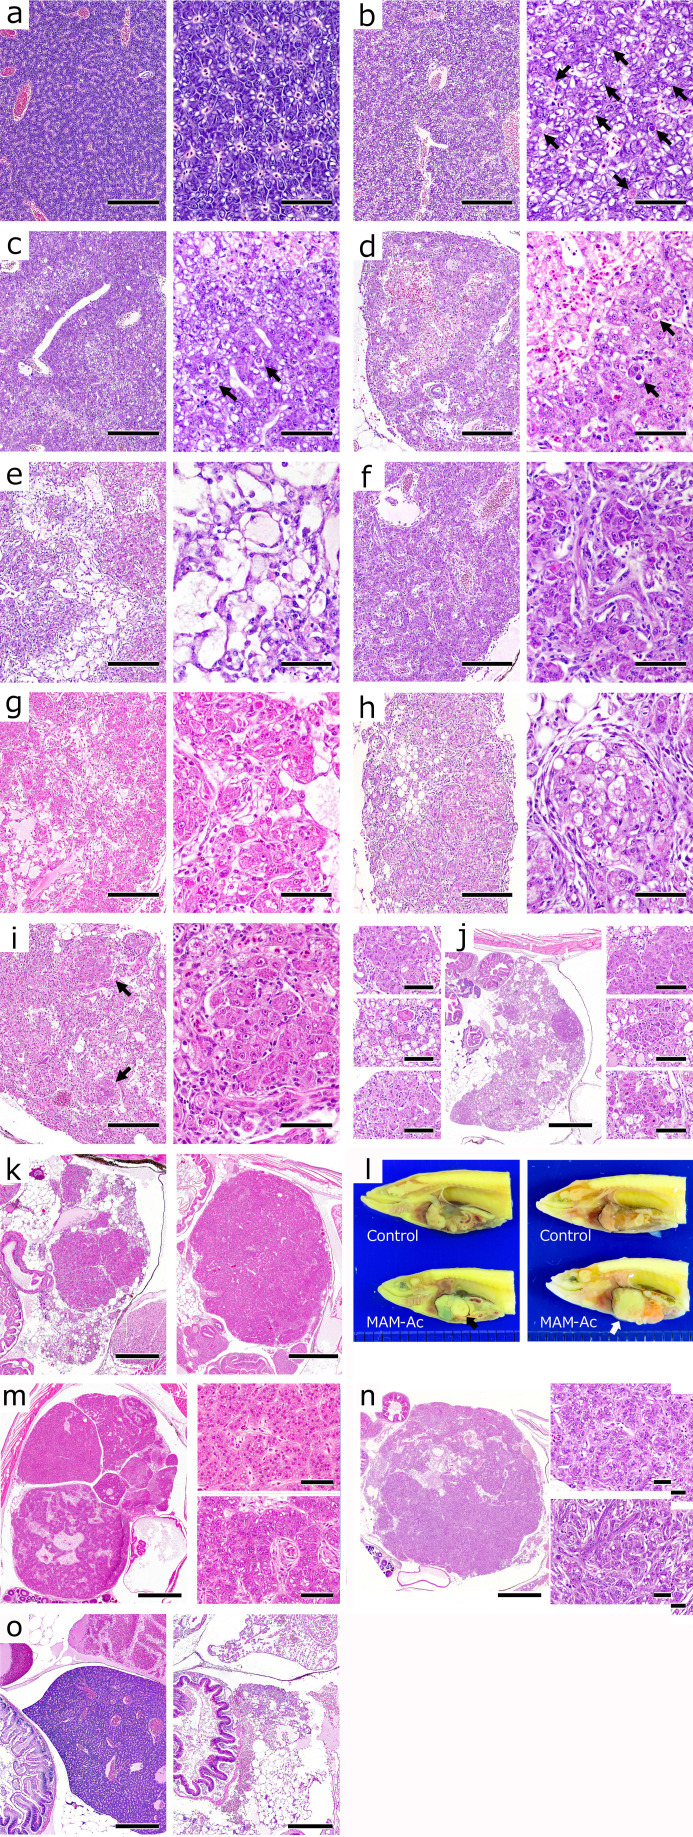
Fig. 3.
Gross appearance and histological changes in the liver. a) Normal liver. Control group. 3 days. Hematoxylin and eosin (HE) stain. Bar = 200 µm (left) and 50 µm (right). b) Vacuolar degeneration with apoptotic bodies (➡) in hepatocytes. Methylazoxymethanol acetate (MAM-Ac) exposure group. 3 days. HE stain. Bar = 200 µm (left) and 50 µm (right). c) Small necrotic foci and marked vacuolated hepatocytes around them. Apoptotic bodies (➡) in hepatocytes. MAM-Ac exposure group. 7 days. HE stain. Bar = 200 µm (left) and 50 µm (right). d) Enlarged focal necrosis with architectural changes of hepatic cords and sinusoids. Apoptotic bodies (➡) and decreased cytoplasmic basophilia in hepatocytes. MAM-Ac exposure group. 10 days. HE stain. Bar = 200 µm (left) and 50 µm (right). e) Large areas of hepatocyte loss filled with hepatic cysts. MAM-Ac exposure group. 14 days. HE stain. Bar = 200 µm (left) and 50 µm (right). f) Proliferation of bile preductular epithelial cells in small spaces between hepatocytes. MAM-Ac exposure group. 14 days. HE stain. Bar = 200 µm (left) and 50 µm (right). g) Proliferation and infiltration of hepatic stellate-like cells or spindle cells. Formation of satellized hepatocytes. MAM-Ac exposure group. 21 days. HE stain. Bar = 200 µm (left) and 50 µm (right). h) Decrease in satellized hepatocytes and replacement with adipose tissue. Regeneration type (R type). MAM-Ac exposure group. 35 days. HE stain. Bar = 200 µm (left) and 50 µm (right). i) Formation of small-sized regenerative hyperplastic nodules (➡) comprising marked eosinophilic hepatocytes with clear nuclei. R type. MAM-Ac exposure group. 42 days. HE stain. Bar = 200 µm (left) and 50 µm (right). j) Multiple, small- to medium-sized regenerative hyperplastic nodules. Atypia in some hyperplastic hepatocytes. R type. MAM-Ac exposure group. 60 days. HE stain. Bar = 500 µm (center) and 60 µm (right/left). k) Replacement of hepatic parenchyma by regenerative hyperplastic nodules. R type. MAM-Ac exposure group. 49 days (left) and 91 days (right). HE stain. Bar = 600 µm. l) Gross appearance of multiple pale masses in liver. Hepatocellular adenoma (⇨) (right/lower). 91 days. Hepatocellular carcinoma (➡) (left/lower). 60 days. m) Regenerative hyperplastic nodules (right/higher) and hepatocellular adenoma (right/lower). Irregular cords of tumor cells showing minor cellular pleomorphism. Proliferation of spindle-shaped cells in interstitium. R type. MAM-Ac exposure group. 91 days. HE stain. Bar = 750 µm (left) and 50 µm (right). n) Hepatocellular carcinoma (right/lower) and regenerative hyperplastic nodules (right/higher). Solid growth of tumor cells showing pleomorphism and anaplasia. R type. MAM-Ac exposure group. 60 days. HE stain. Bar = 900 µm (left) and 50 µm (right). o) Marked hepatic parenchymal atrophy. Replacement of hepatic parenchyma by adipose tissue. (left, control; right, MAM-Ac). Atrophy type. 42 days. HE stain. Bar = 300 µm.

