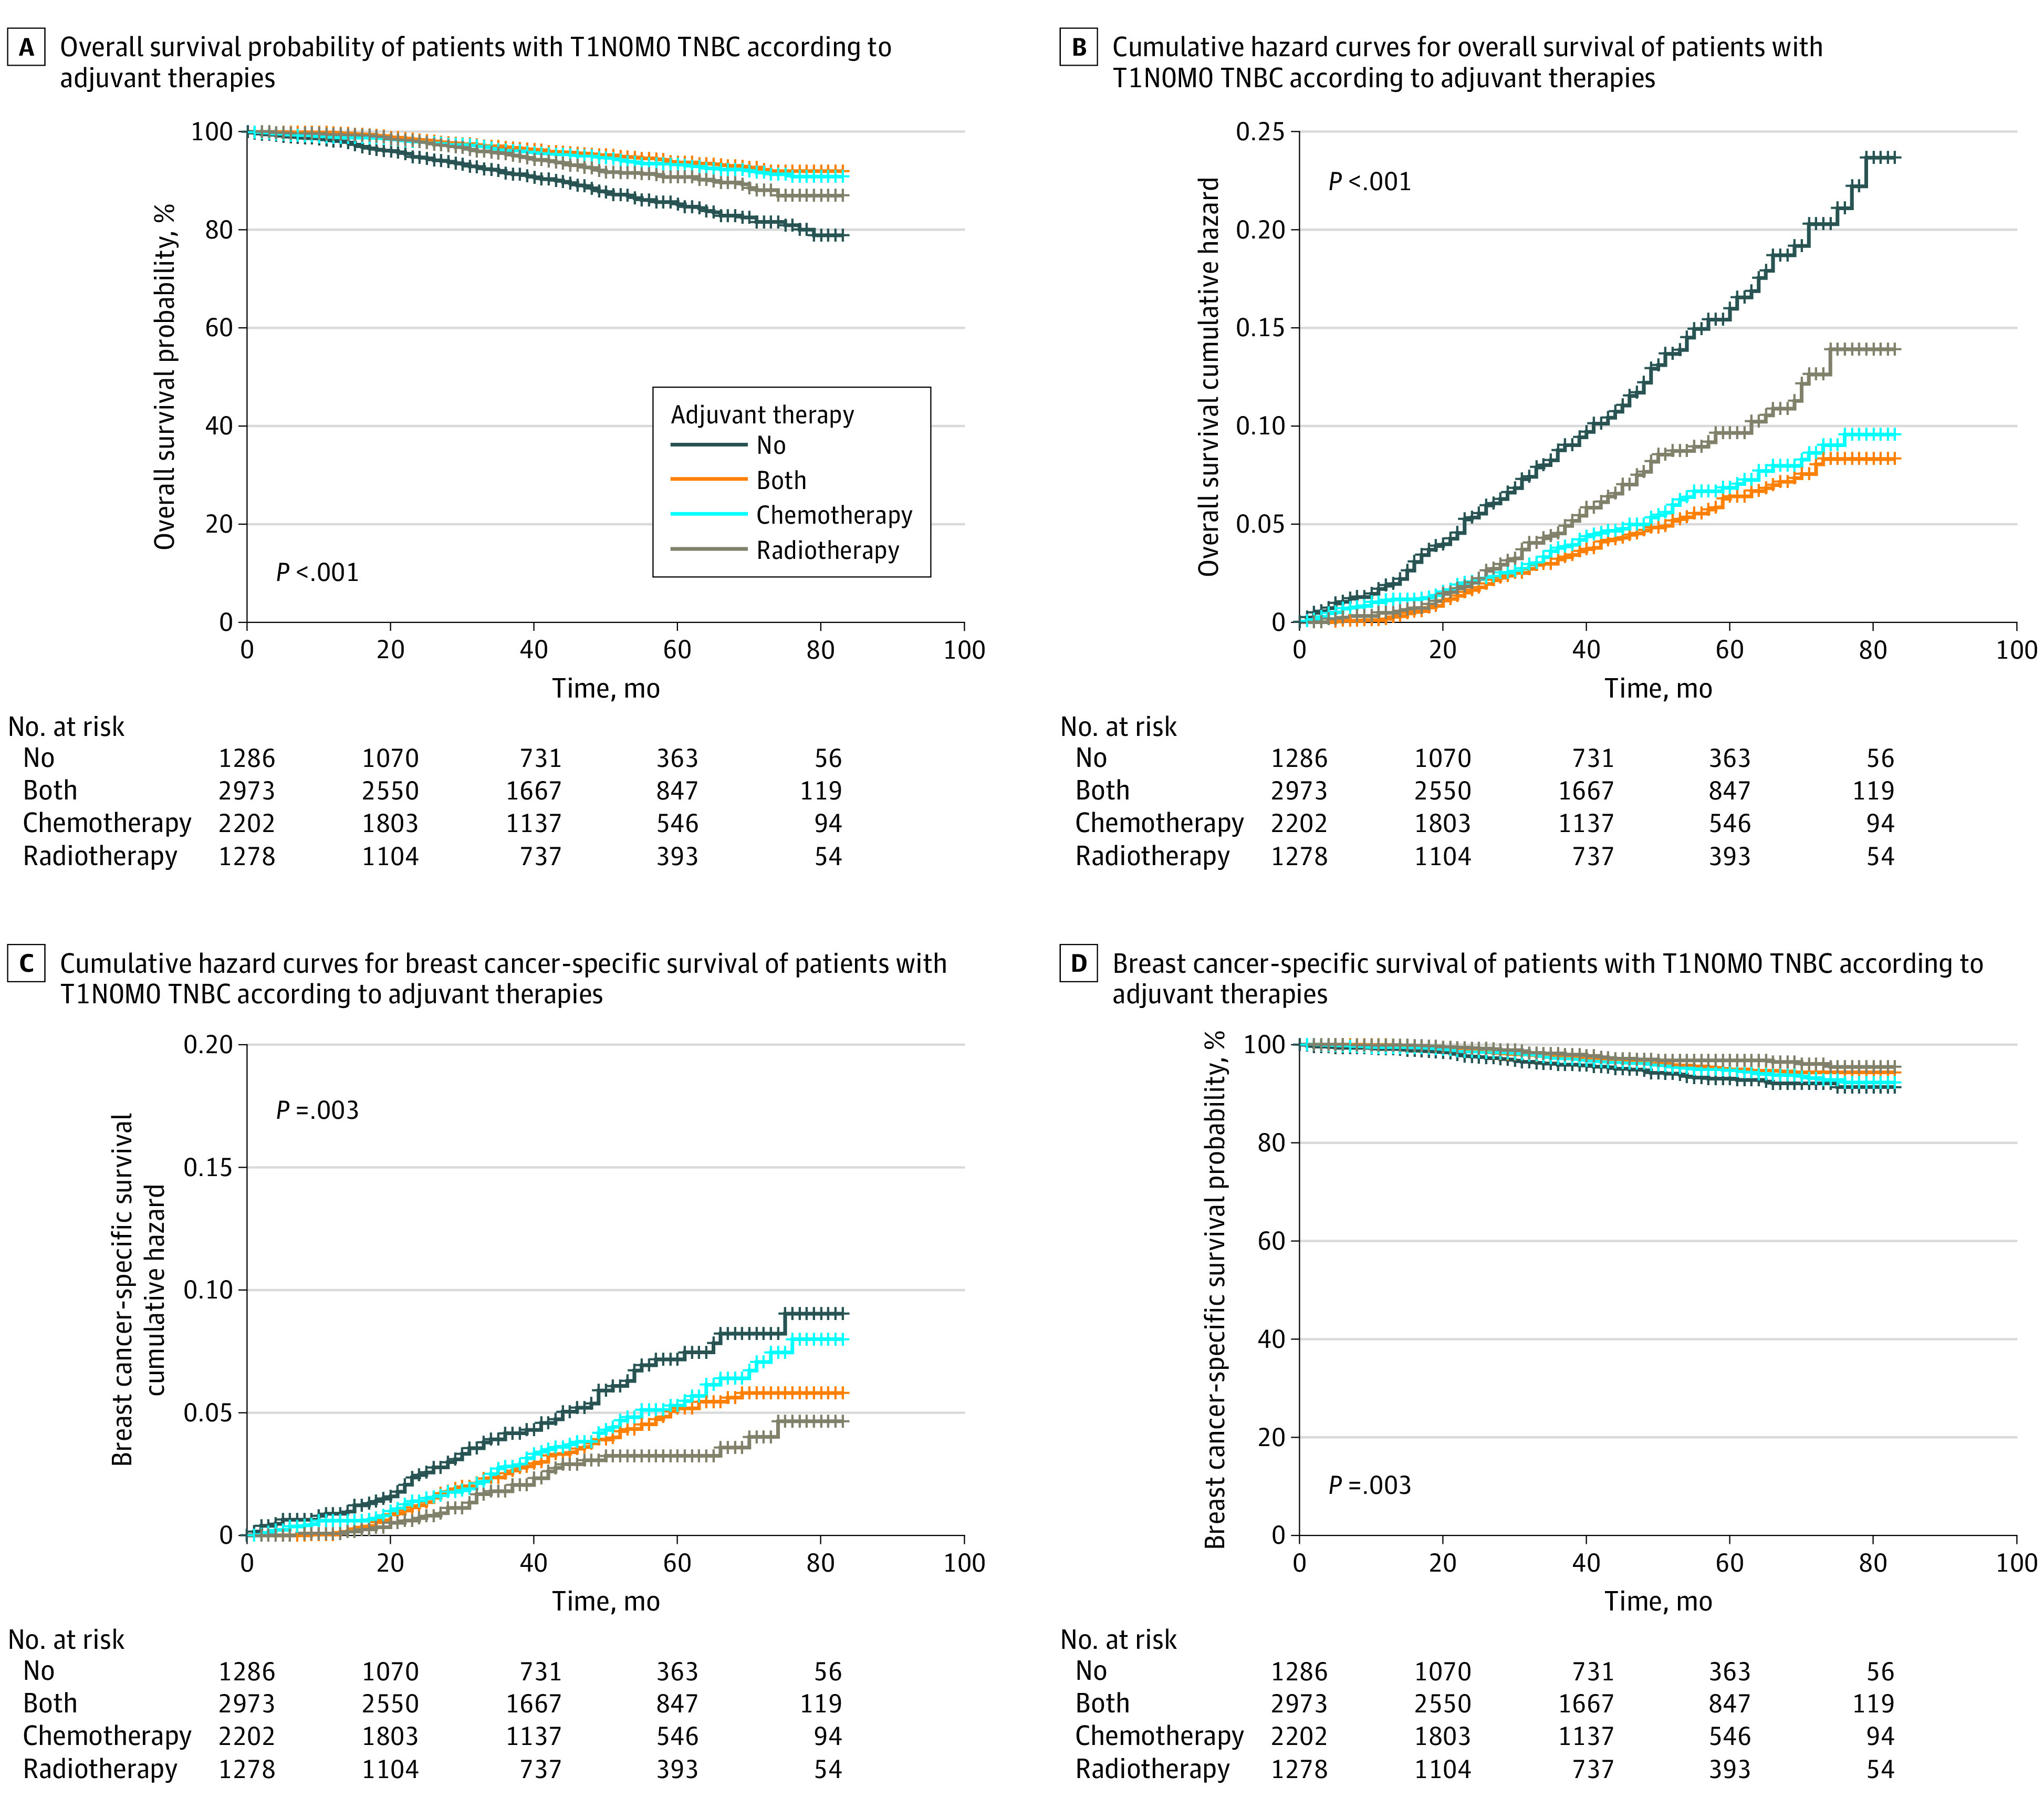
Figure 2. Kaplan-Meier Survival and Cumulative Hazard Curves.

The overall A, and breast cancer-specific survival B, of patients with T1 N0 M0 triple-negative breast cancer (TNBC) according to adjuvant therapies.

The overall A, and breast cancer-specific survival B, of patients with T1 N0 M0 triple-negative breast cancer (TNBC) according to adjuvant therapies.