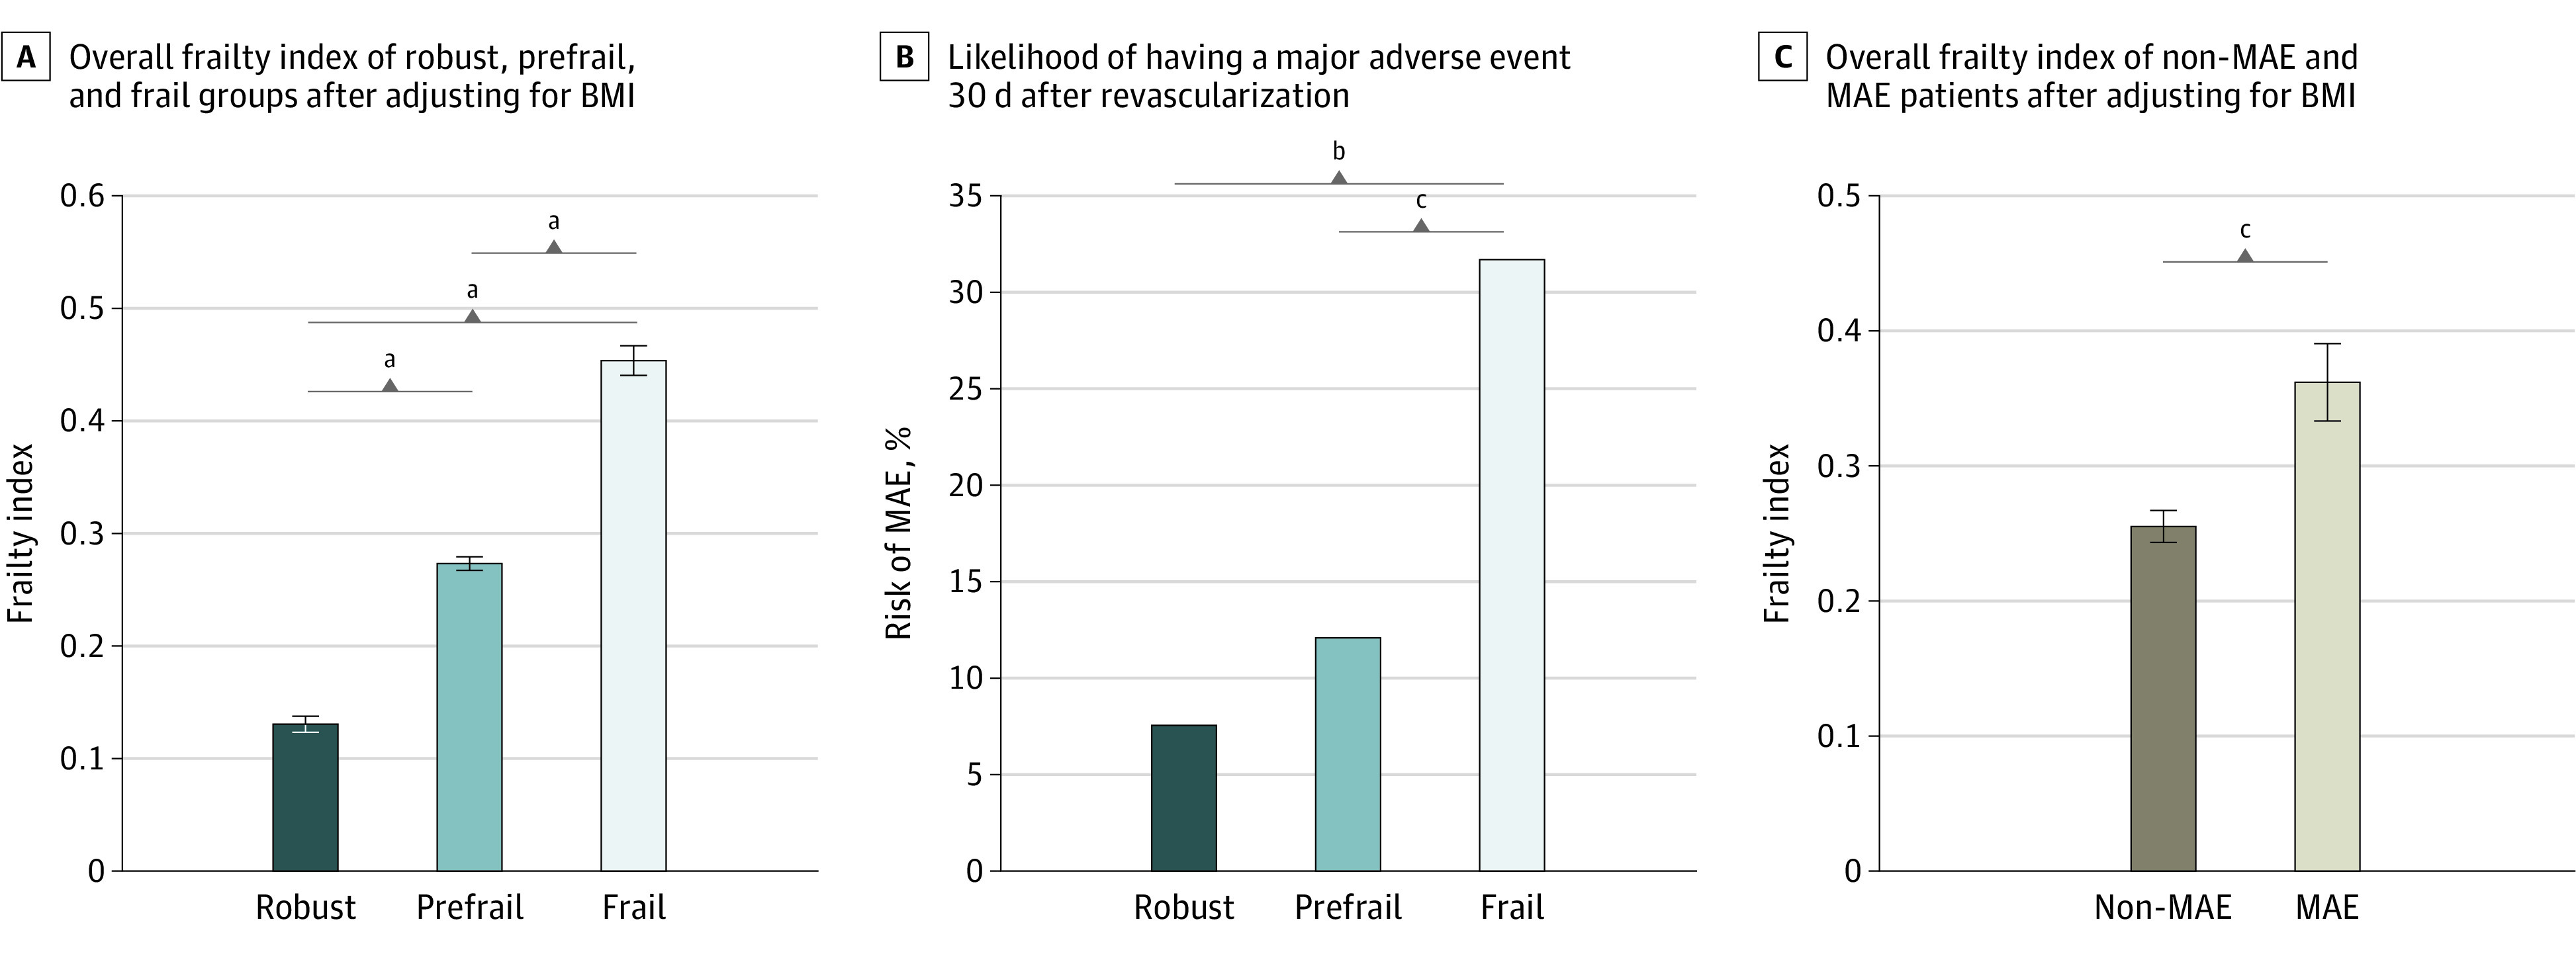
Figure 2. Overall Frailty Index and Risk of Major Adverse Events (MAEs) .

A and C, Whiskers indicate standard errors. BMI indicates body mass index.
aP ≤ .001.
bP ≤ .01.
cP < .05.

A and C, Whiskers indicate standard errors. BMI indicates body mass index.
aP ≤ .001.
bP ≤ .01.
cP < .05.