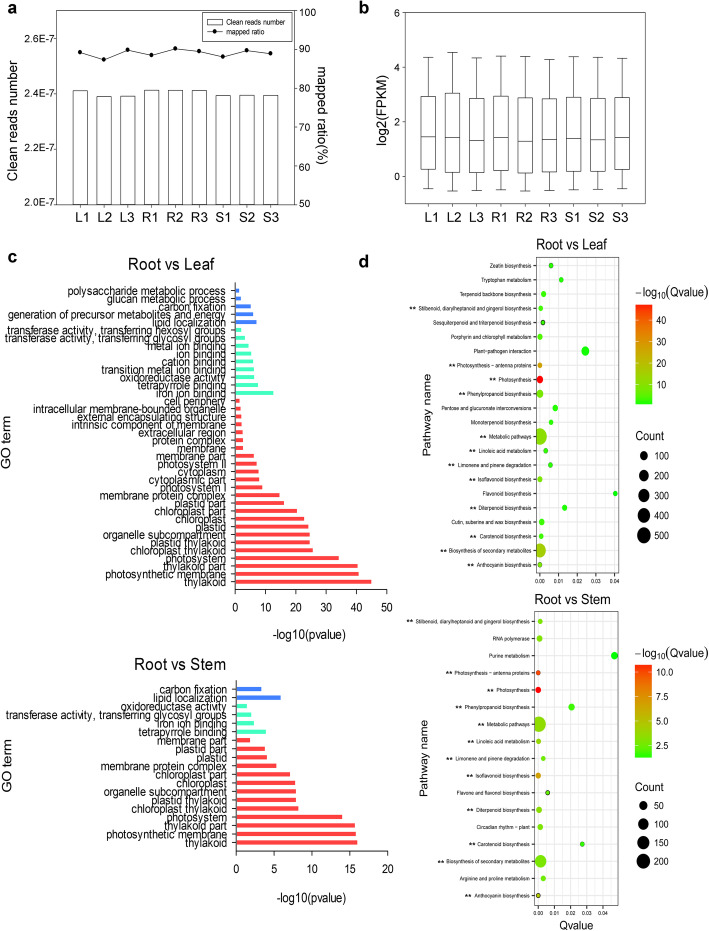
Fig. 1.
Functional annotation and classification of differentially expressed unigenes between different tissues of AMM. a The reads number and mapped ratio to the reference transcriptome of different tissues (L1-L3:leaf; R1-R3:root; S1-S3: stem). The bar plot represents the clean reads number in different tissues, and the dots plot represents mapped ratio of different tissues to the reference transcriptome in different tissues. b The expression level of unigenes in different tissues from AMM (FPKM ≥0.5). We took the logarithm of each FPKM value of all unigenes. c Gene Ontology (GO) functional classifications of differentially expressed unigenes (Only list significantly enriched GO terms, P value≤0.05). Red: CC Cellular Component; Green: MF Molecular Function; Blue: BP Biological Process. d Significantly enriched KEGG pathways between differentially expressed unigenes. The Q value denoted the corrected P-value (Significant pathways were identified by Q value≤0.05). Count denoted the number of differentially expressed unigenes mapped to a certain pathway according to KEGG database. The pathways with ‘**’ denoted the significantly enriched pathways that included in both between the root vs leaf and root vs stem analysis

