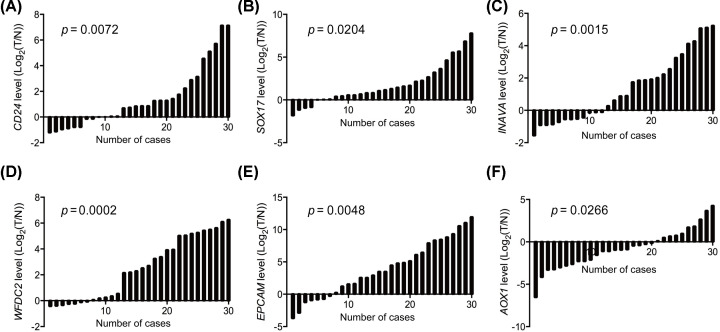
Figure 3. Gene expressional validation for top five up- and down-regulated genes.
Relative genes levels of ovarian cancer and normal tissues measured by qPCR were shown using waterfall plot. (A–F) Represent the expression of CD24, SOX17, INAVA, WFDC2, EPCAM, AOX1 respectively. The fold change of relative genes expression (log2[T/N]) > 1 or < −1 was defined as significant. N, normal control; T, tumor of ovarian cancer.

