Fig. 3.
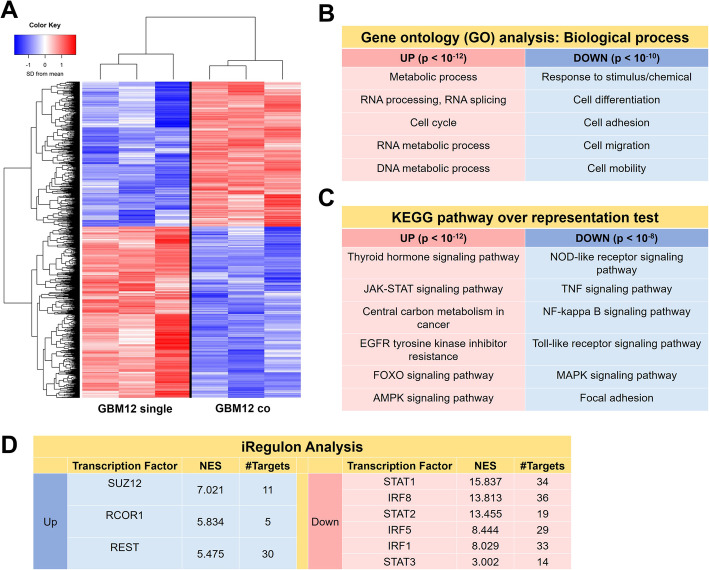
Soluble signals from microglia induced shifts in GBM12 cell transcriptome. a RNAseq and differential gene expression analysis (p < 0.05) identified 1563 upregulated genes and 1846 downregulated genes in GBM12 co compared to GBM12 single. Selected (b) gene ontology (GO) and (c) KEGG pathway terms suggest GBM-MG interactions underlie upregulated expression of genes involved in GBM proliferation and genes with diminished expression associated with GBM invasion. (n = 3 for GBM12 single and GBM12 co) (d) Significant putative genes from the top 50 genes with normalized enrichment score > 3 were identified via iRegulon

