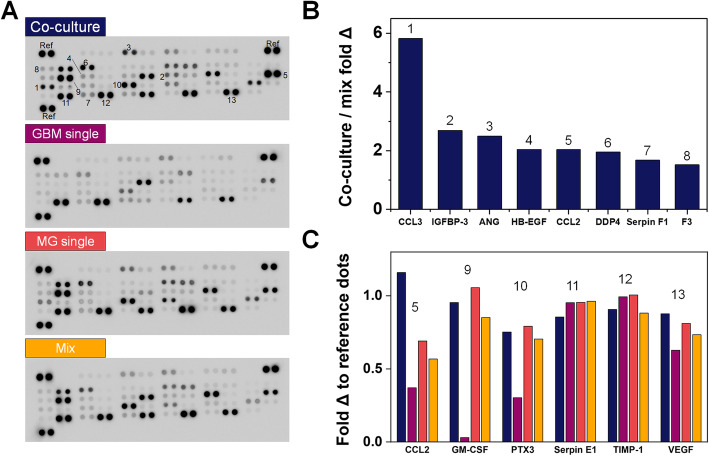
Fig. 6.
Profiling GBM-MG (GBM12-HMC3) secretome linked to decreased GBM cell invasion. a Proteome ProfilerTM Array analysis of secretome profiles from conditioned media of 4 distinct culture conditions: GBM-MG co-culture; GBM single; MG single; 1:1 Mix of GBM single; and MG single. b Eight factors that displayed > 1.5 fold change in GBM-MG co-culture versus Mix media groups. c Six factors (from GBM-MG co-culture) that displayed greater than 0.75-fold change versus the positive reference dots. Numbers (1–13) correspond to positions labeled on blots in a. Raw data are available in Table S3

