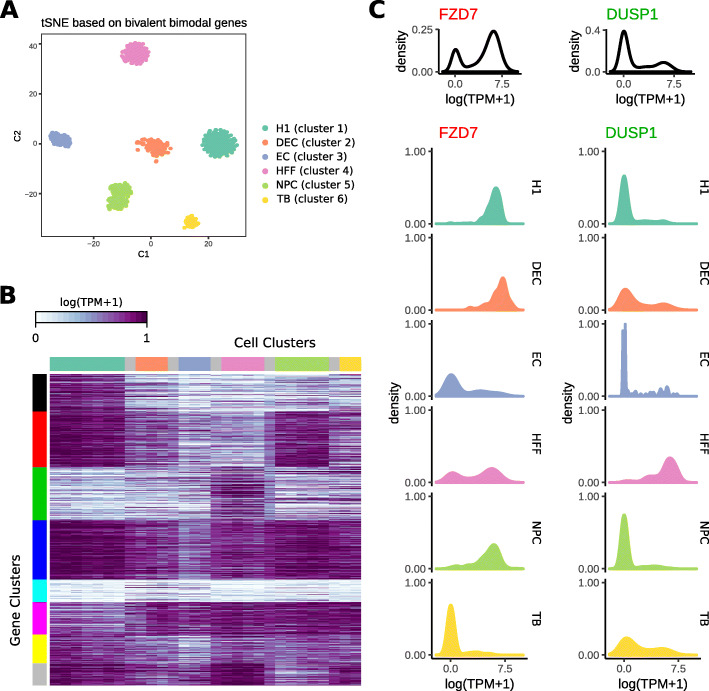
Fig. 1.
Bivalent and bimodal genes in H1 differentiation data. (a) t-SNE plot of bivalent and bimodal genes in H1 differentiation data. Cells were colored based on cell types, which perfectly matched the clusters. (b) Heatmap of fractional expression values obtained from the ratio of active cells per window. Columns represent cells and rows represent genes. Cells were ordered by cell types, split into 30 windows and colored by the cell type (Grey represents the cells in between two cell types). Genes were clustered based on the fractional expression values. (c) Example genes from clustering shown in (b). FZD7 belongs to the 2nd gene cluster (red) and DUSP1 belongs to the third gene cluster (green). Top panel shows the overall density of log(TPM+1). Bottom panel shows the density of log(TPM+1) for cells in each cell type

