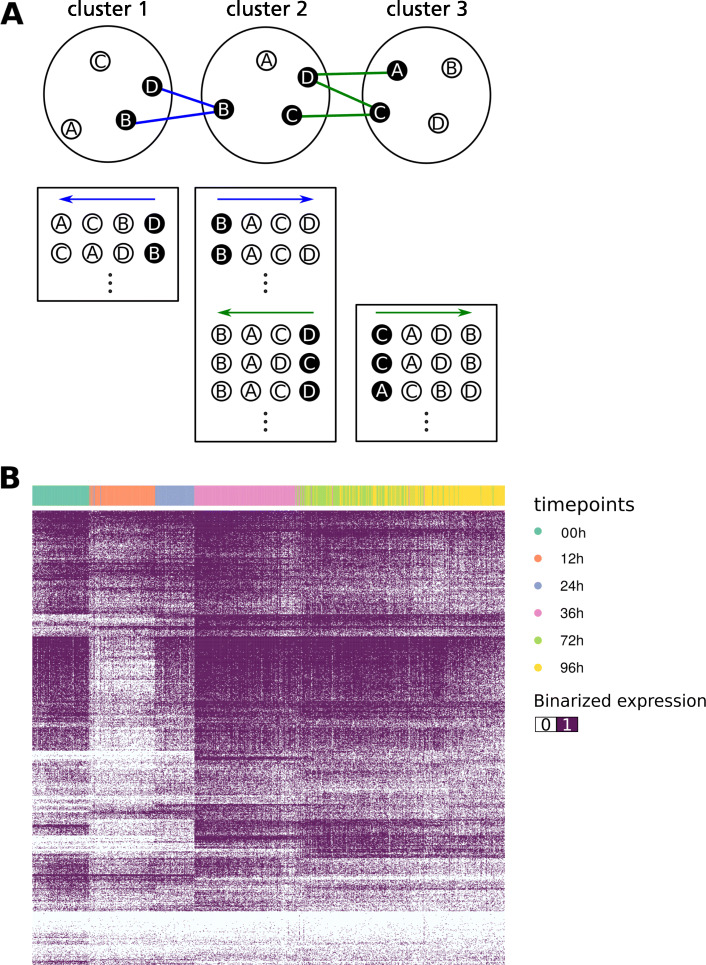
Fig. 3.
Pseudotime trajectory estimation (a) Top. Each circled letter represents a cell in a cluster. Letters highlighted in black represent the connecting cells that show low variation of information to cells in the adjacent cluster. Cells in clusters are unordered. Bottom. Cells arranged in different orders within rectangles represent the cell orderings (sequence) within each cluster based on the variation of information between the connecting cells and the rest of the cells in the cluster. Refer to the main text for more explanation. (b) Heatmap of log(TPM+1) expression values of bivalent and bimodal genes from H9 time-series data. Cells (columns) are arranged according to the pseudotime ordering and colored according to the experimental timepoints. Genes (rows) are ordered using hierarchical clustering

