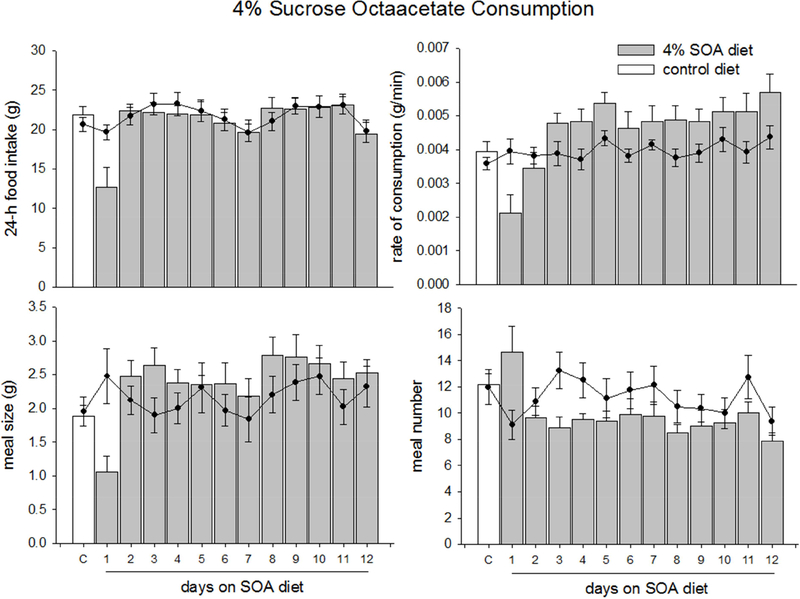
Figure 1.
Data are average food intake, rate of feeding, meal size, or number of meals ±SEM of rats fed a control and sucrose octaaceetate (SOA) diet. A-D White bars represent feeding behaviors of animals while on a control diet; gray bars represent the feeding behaviors of animals while on the 4% sucrose octaacetate (SOA) diet. The filled circles overlaid on the graph represent the data collected from animals who consumed only the control diet. The data labeled ‘C’ (for control) represents the 3-day average of the behavioral measures before the test diet. Food intake (A) meal size (B) and rate of feeding (D) decreased in the first day of diet exposure, and returned to baseline levels on the second day. Meal number (C), increased during the first night but fell on the second day.

