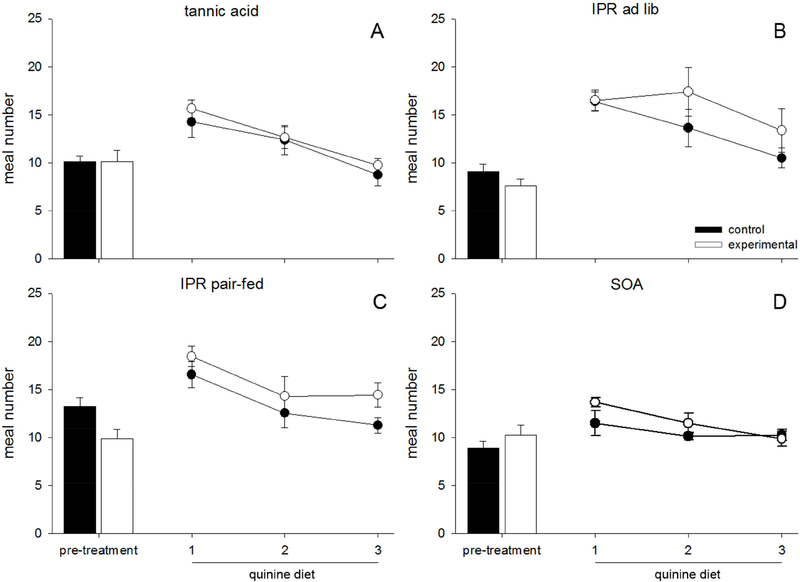
Figure 5.
Data are average number of meals ±SEM consumed in 24h in rats fed tannic acid (TA), sucrose octaacetate (SOA), or control diet. (A-D) Closed bars represent the 3-day average of meal number for control animals during the pre-treatment phase, during which they consumed control diet, while open bars represent experimental animals who were exposed to either TA (A), IPR injections (B, C), or SOA (D). Closed circles represent quinine intake of control animals, while open circles represent quinine intake of pretreated animals. (A-D) No group of animals differed in meal number at any point during either the pre-treatment or the quinine phases.

