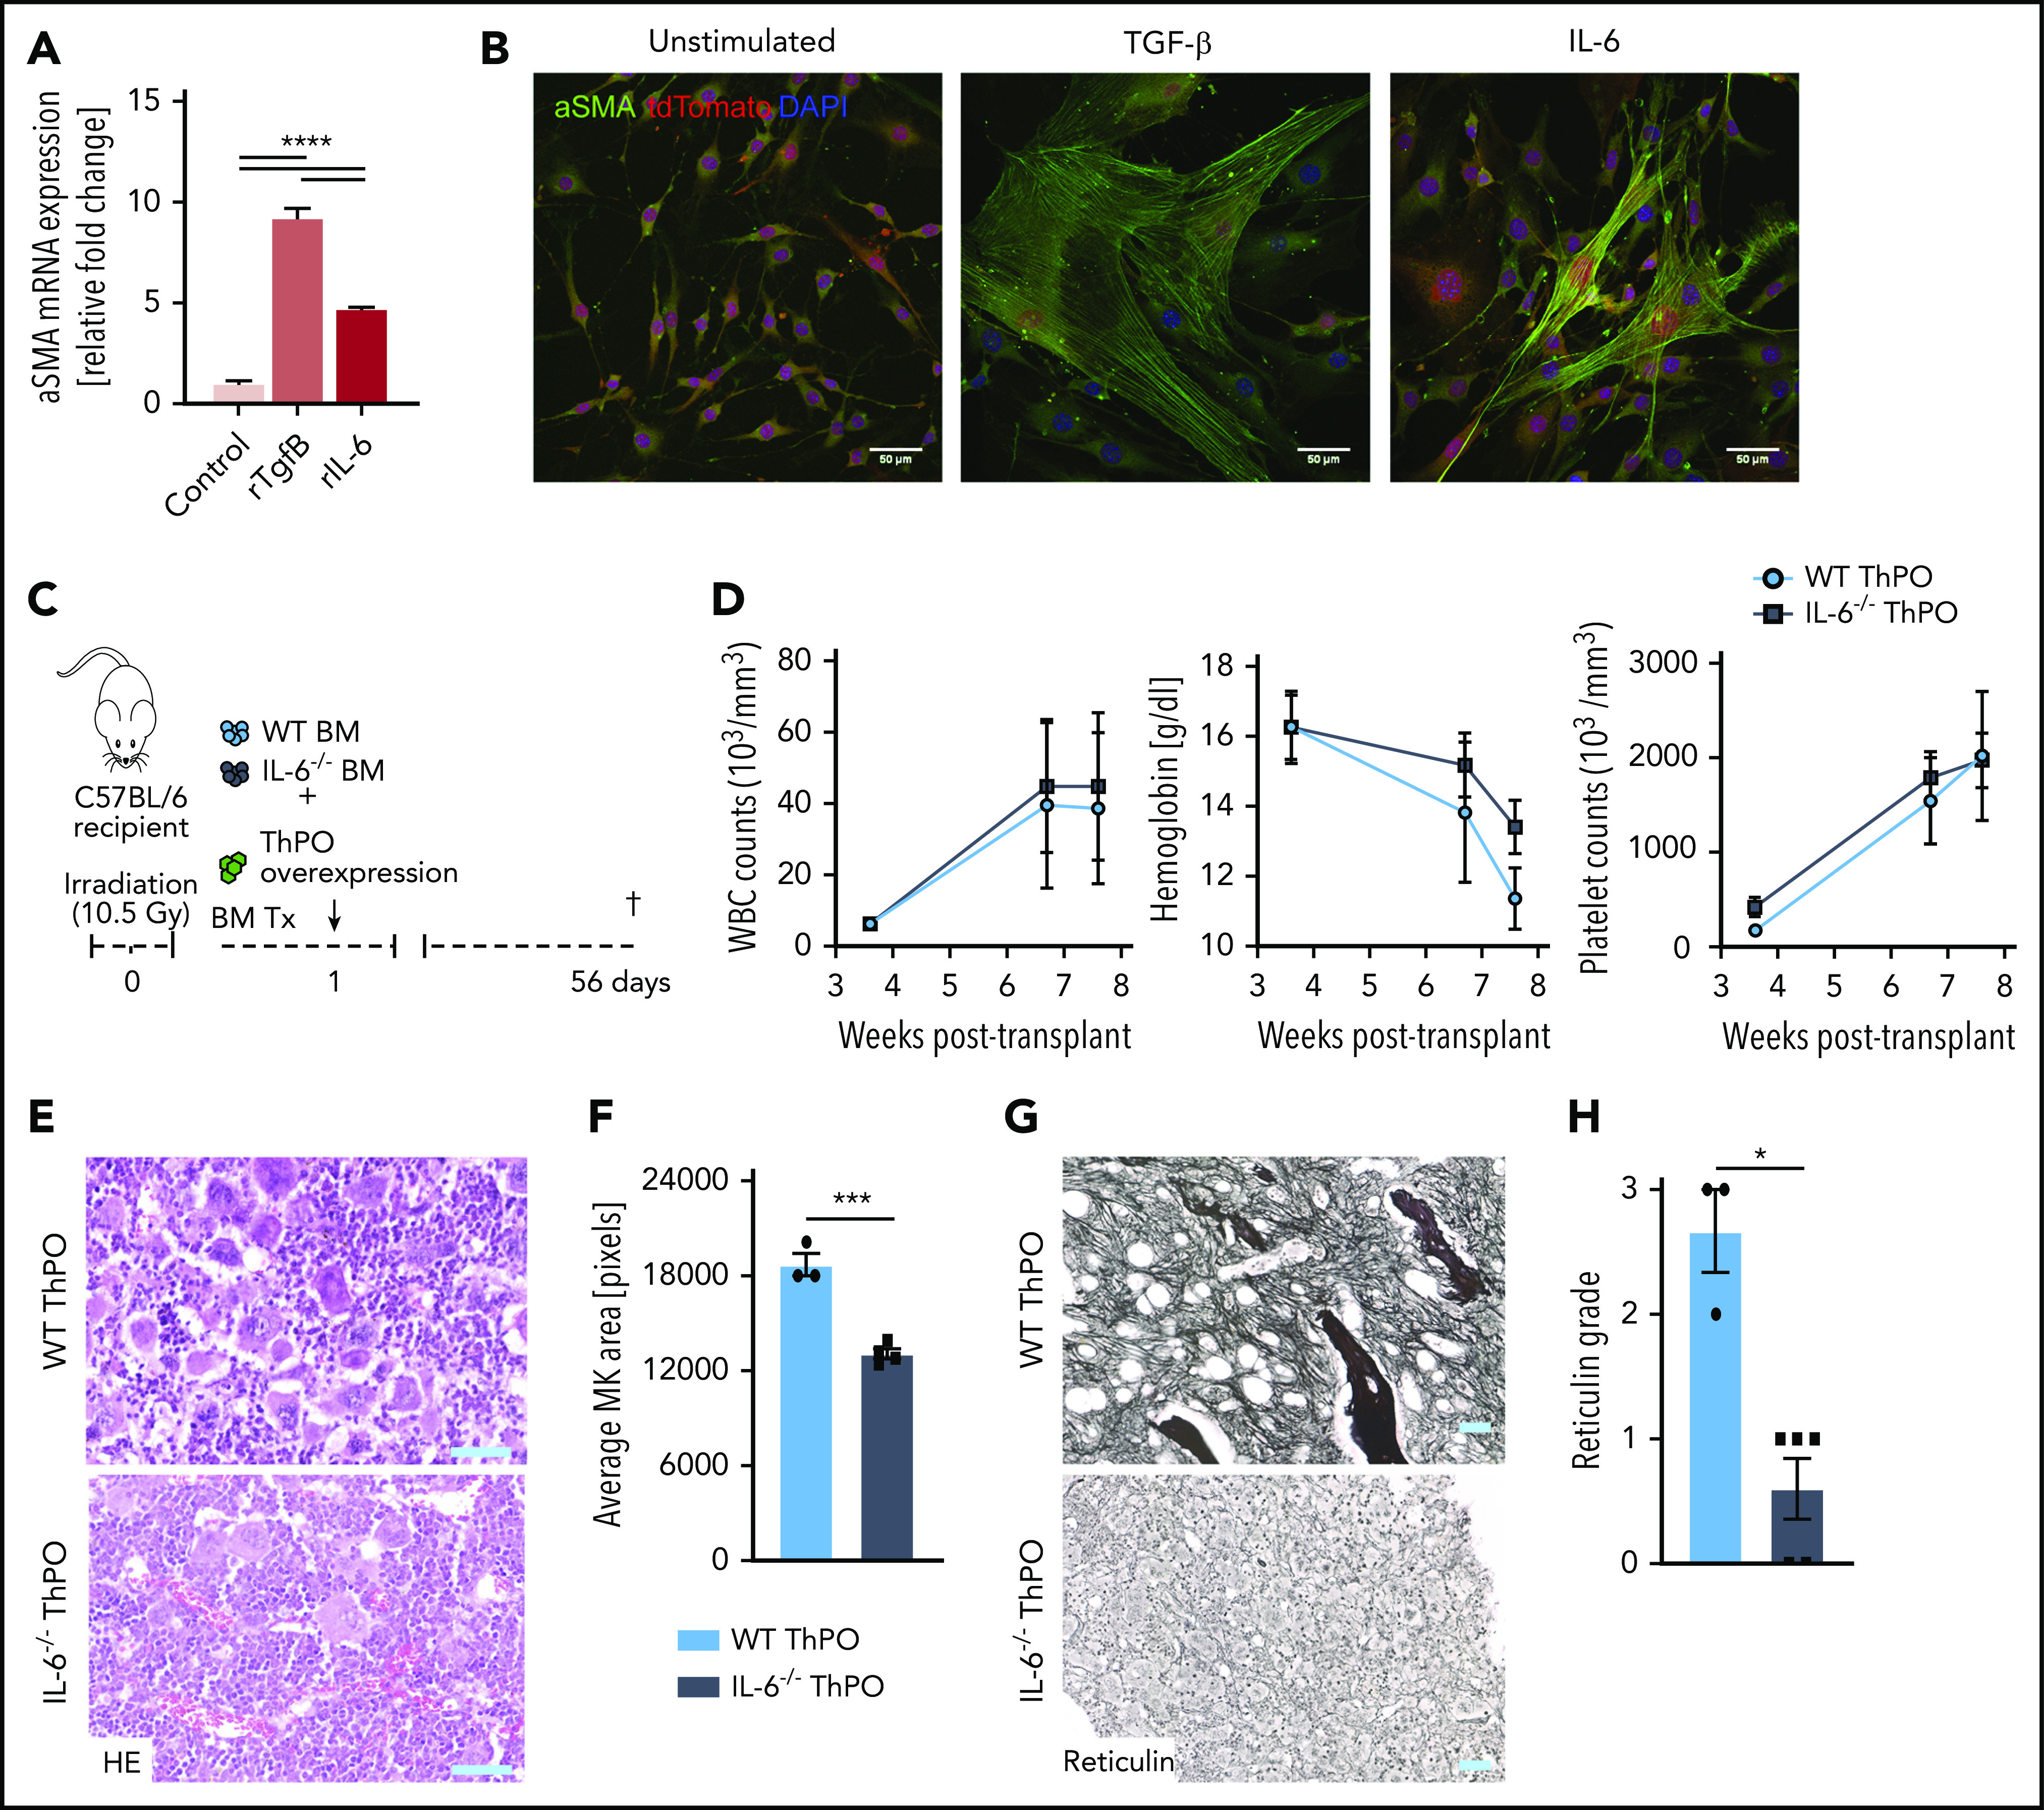
Figure 7.

IL-6 knockout in BM reduces fibrosis in a ThPO-induced model of PMF. (A) Quantitative polymerase chain reaction of αSMA and collagen1α1 in primary murine Gli1+ stromal cells stimulated with recombinant cytokines for 72 hours. n = 3. (B) Representative immunofluorescence images of primary Gli1+ stromal cells stimulated with recombinant cytokines for 72 hours and stained for αSMA. Scale bar, 50 μm. (C) Schematic representation of transplantation of WT or IL-6−/− ckit+ cells in a model of ThPO-induced fibrosis (n = 3, WT ThPO; n = 5, IL-6−/− ThPO). (D) WBC, hemoglobin, and platelet parameters in weeks posttransplantation. (E) Representative images of hematoxylin and eosin (HE) staining of WT ThPO or IL-6−/− ThPO femurs. Original magnification ×20; scale bar, 100 μm. (F) Average pixel size of MKs in 3 randomly selected panels from WT ThPO or IL-6−/− ThPO femurs. Original magnification ×10; scale bar, 100 μm. (G) Representative images of reticulin staining (fibrosis) in WT ThPO or IL-6−/− ThPO femurs. (H) Quantification of myelofibrosis grade based on reticulin staining in WT ThPO or IL-6−/− ThPO femurs (Kruskal-Wallis multiple comparisons test). Data are shown as mean ± standard error of the mean, 1-way analysis of variance followed by Tukey’s post hoc test. *P < .05, ***P < .001, ****P < .0001. mRNA, messenger RNA.
