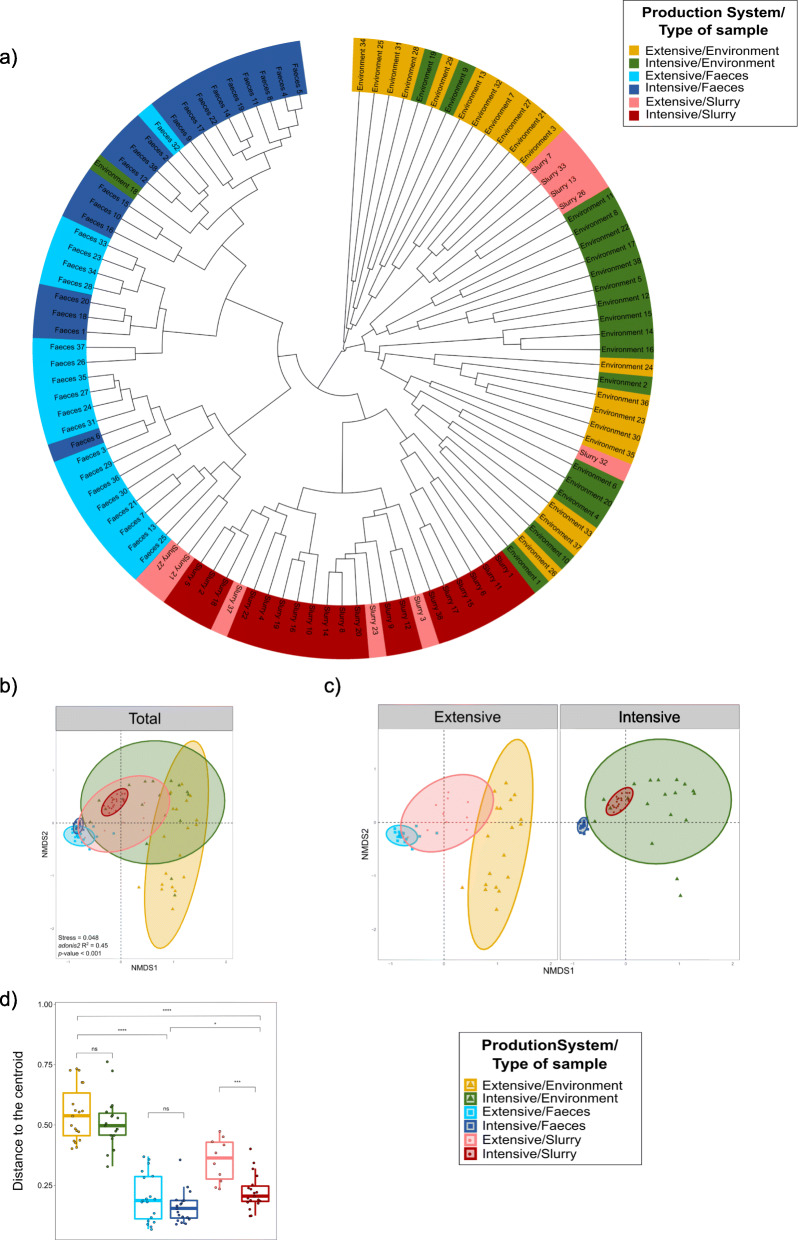
Fig. 2.
Resistome structure in samples from three sample types on intensive and extensive farms. a Dendrogram showing the complete linkage clustering of Bray-Curtis dissimilarities among intensive and extensive pig farms per sample type. b Two-dimension non-metric multidimensional scaling (NMDS) based on Bray-Curtis dissimilarities. Subsampling was carried out by the three types of samples within each production system prior to performing ordination analysis and PERMANOVA. The centroid of each ellipse represents the group mean, and the shape was defined by the covariance within each group. c NMDS resulting from the division of the previous analysis by the two production systems to observe clearer differences. d Distance to the centroid for the evaluation of homogeneity of variances within each group. n = 105 metagenomes from 38 independent farms. Nineteen metagenomes per production system per sample type were used, with the exception of extensive-slurry (n = 9).

