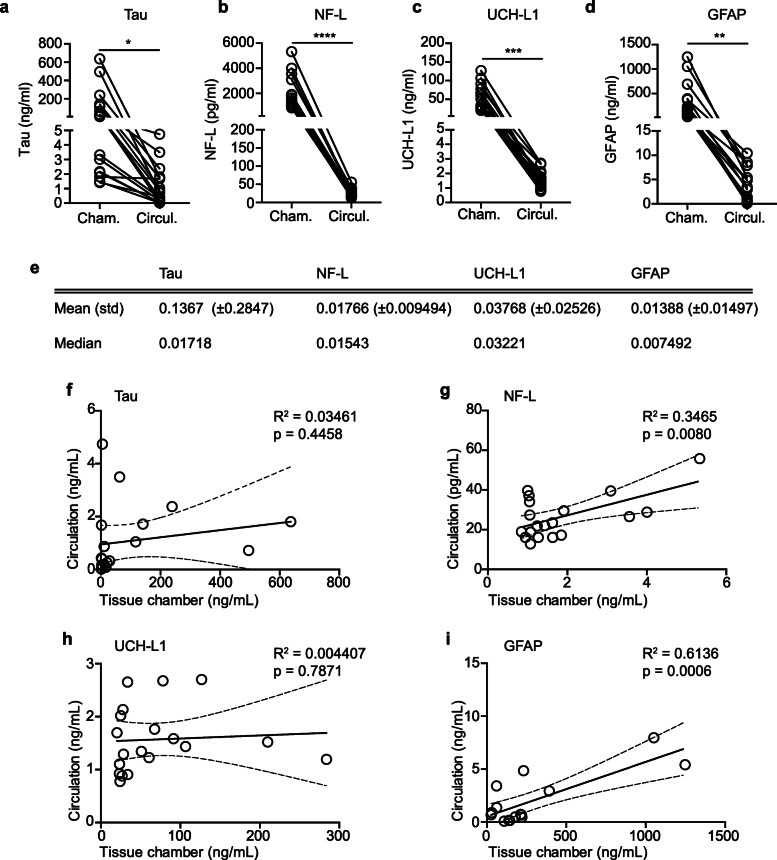
Fig. 4.
Fluid biomarkers levels in tissue chamber vs. circulation. Total tau (a) NF-L (b) UCH-L1 (c) and GFAP (d) were quantified in tissue chamber and circulation media four days after last medium change. e) Ratio circulation:chamber calculation. The correlation between the level of total tau (f) NF-L (i) UCH-L1 (j) and GFAP (k) in circulation and tissue chamber were assessed through Pearson correlation analysis. Points in graphed data represent individual bioengineered vessels, bars represent mean, error bars represent ±SEM and analysed by paired Student’s t-test or Pearson correlation. The correlation coefficient (R2) and p-value are shown in each panel. * = p < 0.05, ** = p < 0.01, *** = p < 0.001, **** < p = 0.0001

