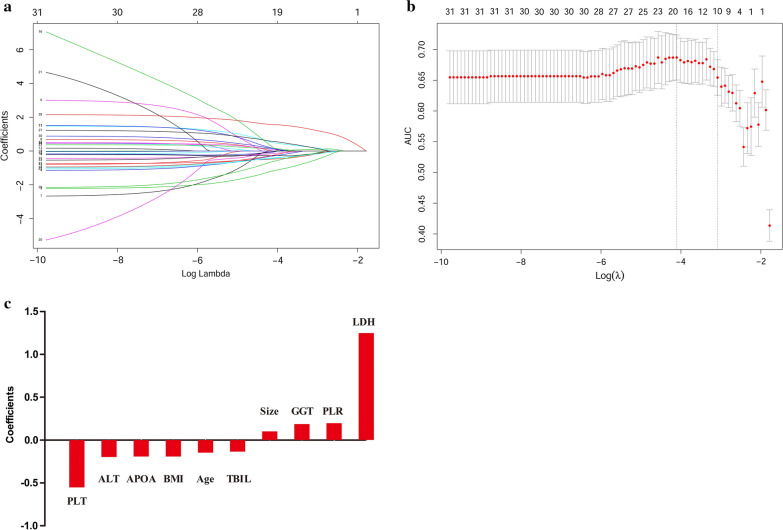
Fig. 1.
Potential predictors selection using Lasso regression analysis. a The changing trajectory of each predictor. The horizontal axis represents the log value of the each predictor λ, and the vertical axis represents the coefficient of the independent predictor; b Tuning the penalty parameter in Lasso regression analysis using tenfold cross validation and 1 standard error of the minimum criteria; c Histogram shows the role of each predictor that contribute to the developed prognostic model. The predictors that contribute to the prognostic model are plotted on the x-axis, with their coefficients in the Lasso regression analysis plotted on the y-axis

