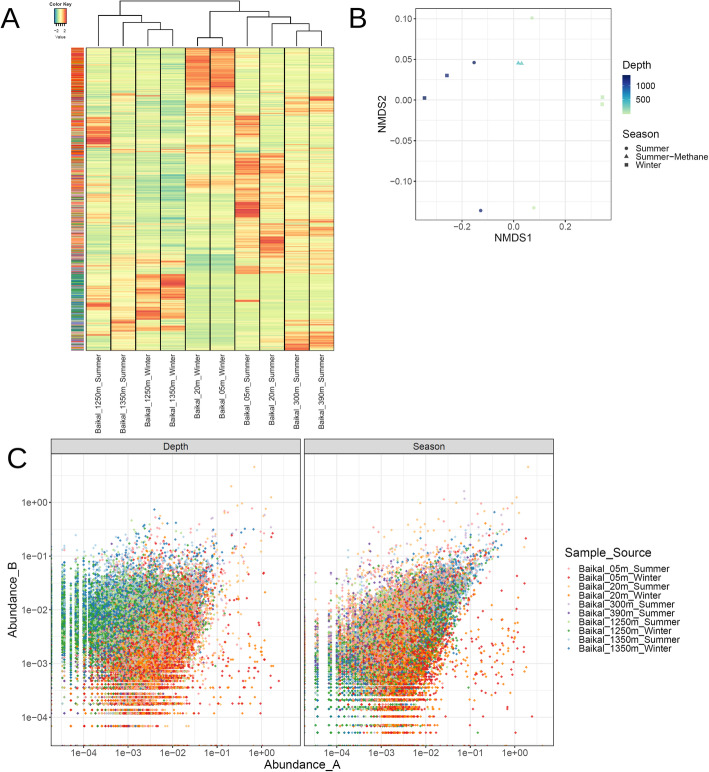
Fig. 2.
Lake Baikal viral community composition. a Heatmap depicting the Z-score transformed abundances of 19,475 bona fide viral sequences across ten metagenomes from Lake Baikal. Both samples (columns) and viral sequences (rows) were subjected to hierarchical clustering based on Bray-Curtis dissimilarity distances. Side row colors indicate the sample from which each viral sequence was assembled. b Non-metric multidimensional scaling comparison of the abundance of viral sequences across 10 Baikal metagenomes based on Bray-Curtis dissimilarity distances. c Scatter plots depicting the abundances of each viral scaffold paired by depth and season. In the left panel, the relative abundances of sequences in the photic samples are displayed in the X axis while the abundances in the aphotic samples are displayed in the Y axis. Samples were paired as follows: 5 m winter × 1250 m winter; 5 m summer × 1250 m summer; 20 m winter × 1350 m winter; 20 m summer × 1350 m summer. In the right panel, the relative abundances of sequences in the winter samples are displayed in the X axis while the abundances in the summer samples are displayed in the Y axis. Samples were paired as follows: 5 m winter × 5 m summer; 20 m winter × 20 m summer; 1250 m winter × 1250 m summer, 1350 m winter × 1350 m summer

