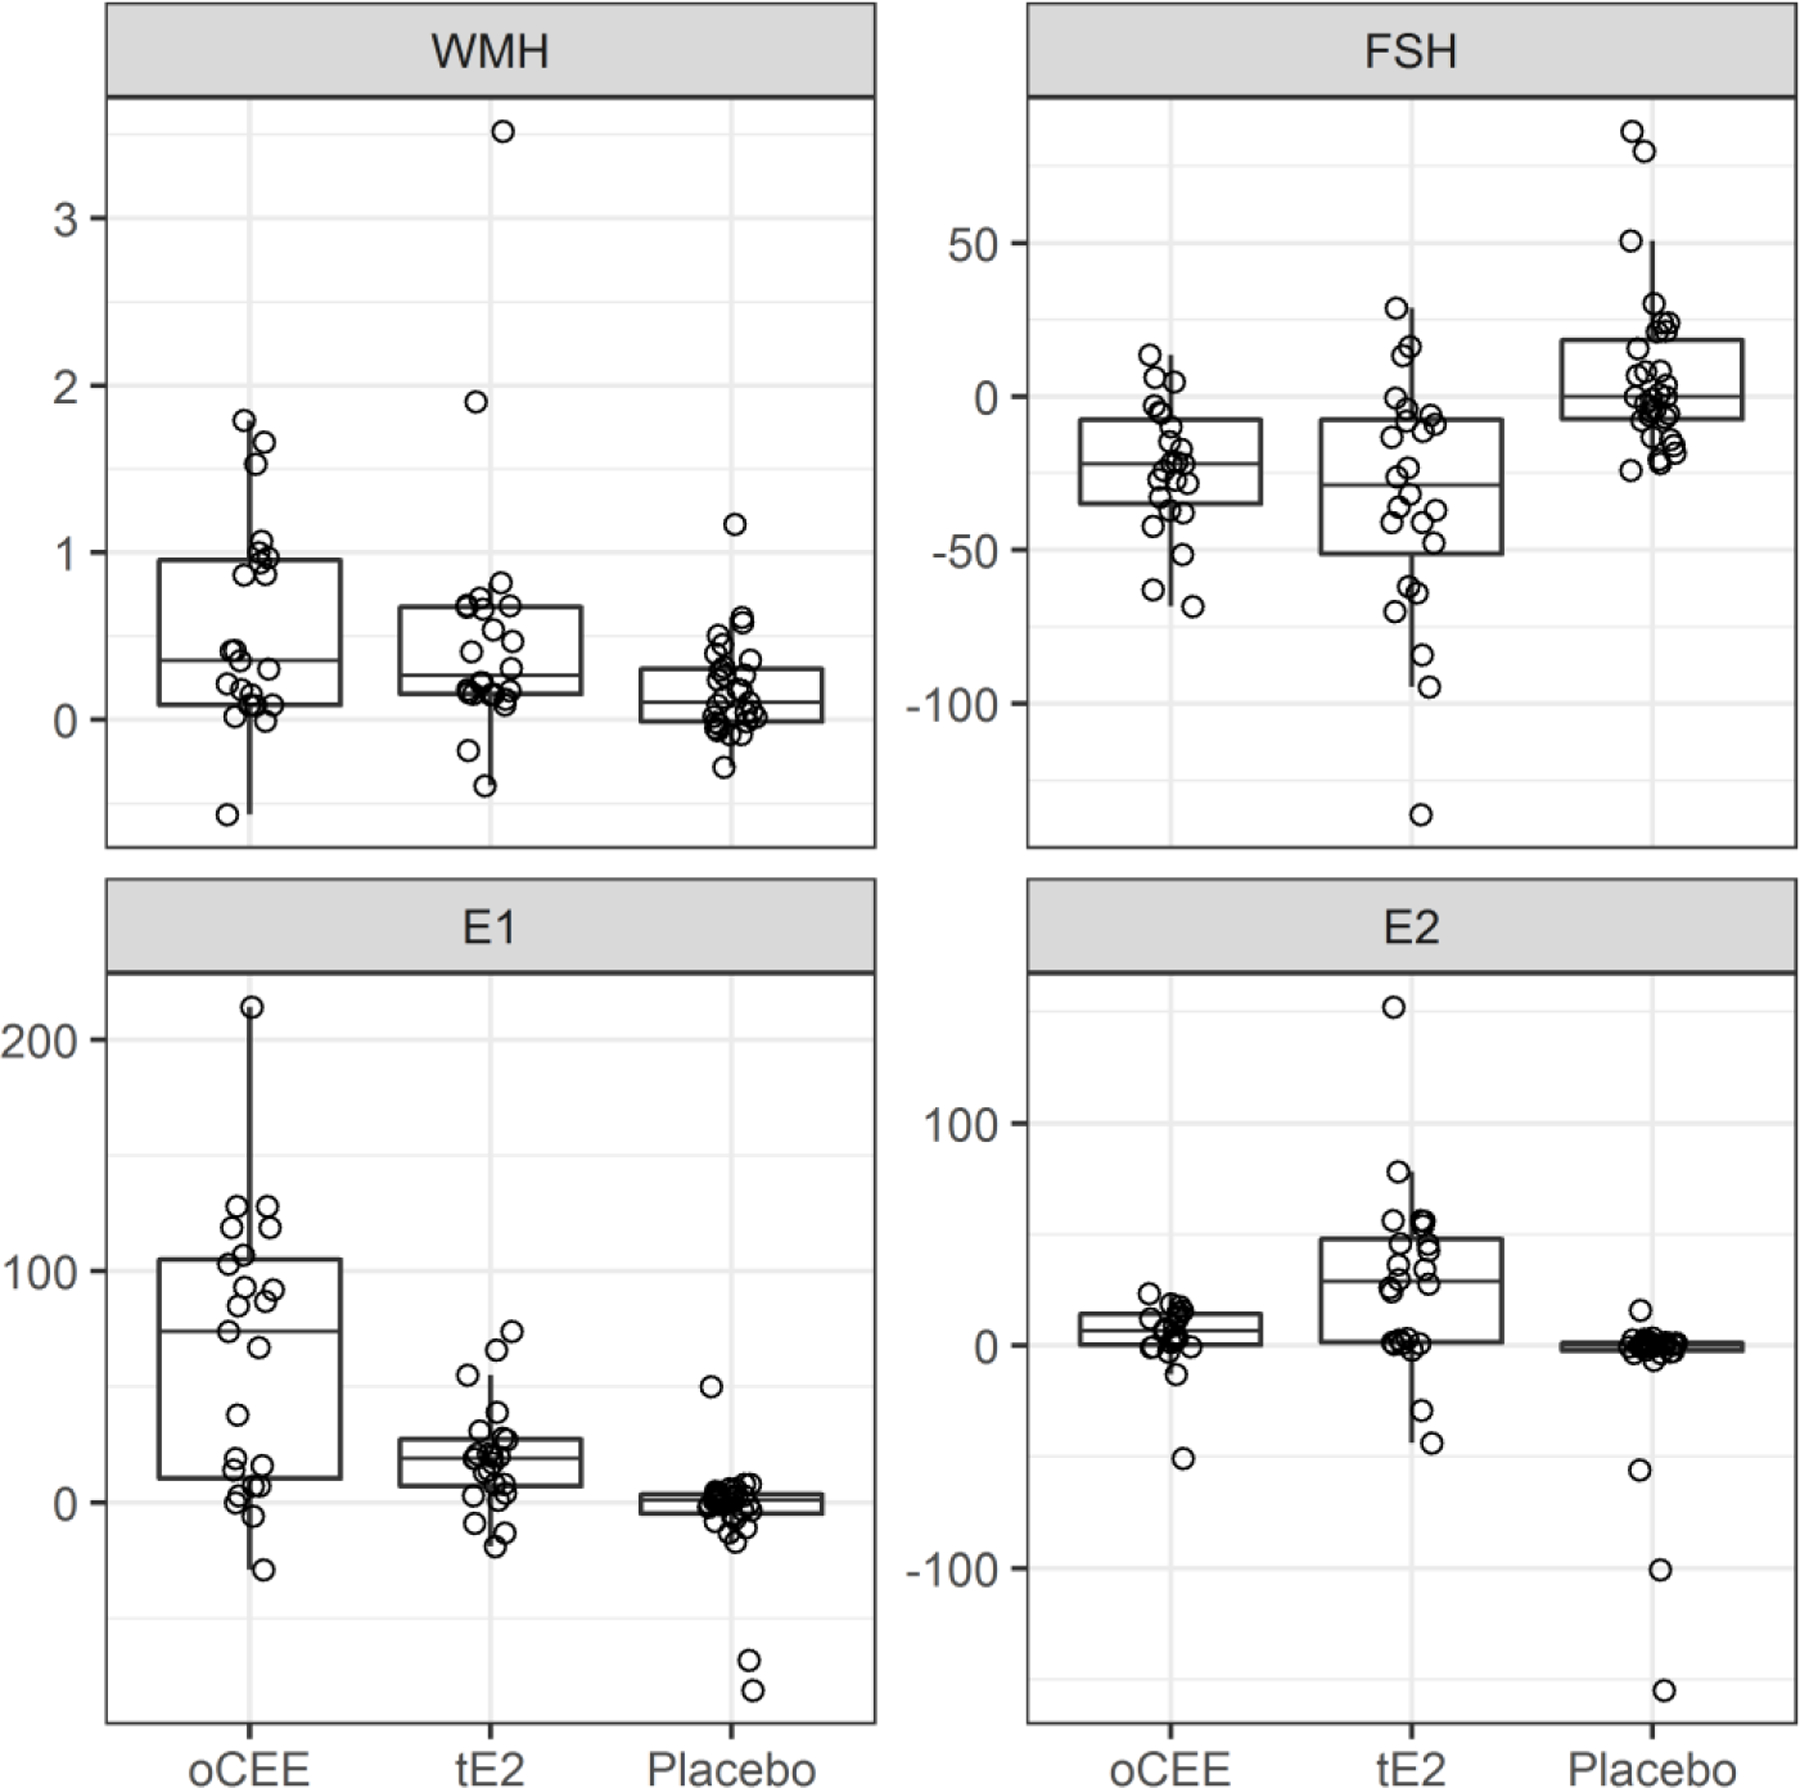
FIG. 1.

Boxplots of total change in WMH volume and total changes in hormones levels from baseline to month 48. The horizontal lines of the box from bottom to top show the 25th, 50th, and 75th percentiles of the data. The height of the box, 75th to 25th percentile, is the interquartile range (IQR). Whiskers extend 1.5*IQR from the box. Points farther out are considered outliers and drawn individually. E1, estrone; E2, estradiol, FSH, follicle-stimulating hormone; oCEE, oral conjugated equine estrogen; tE2, transdermal estradiol; WMH, white matter hyperintensity.
