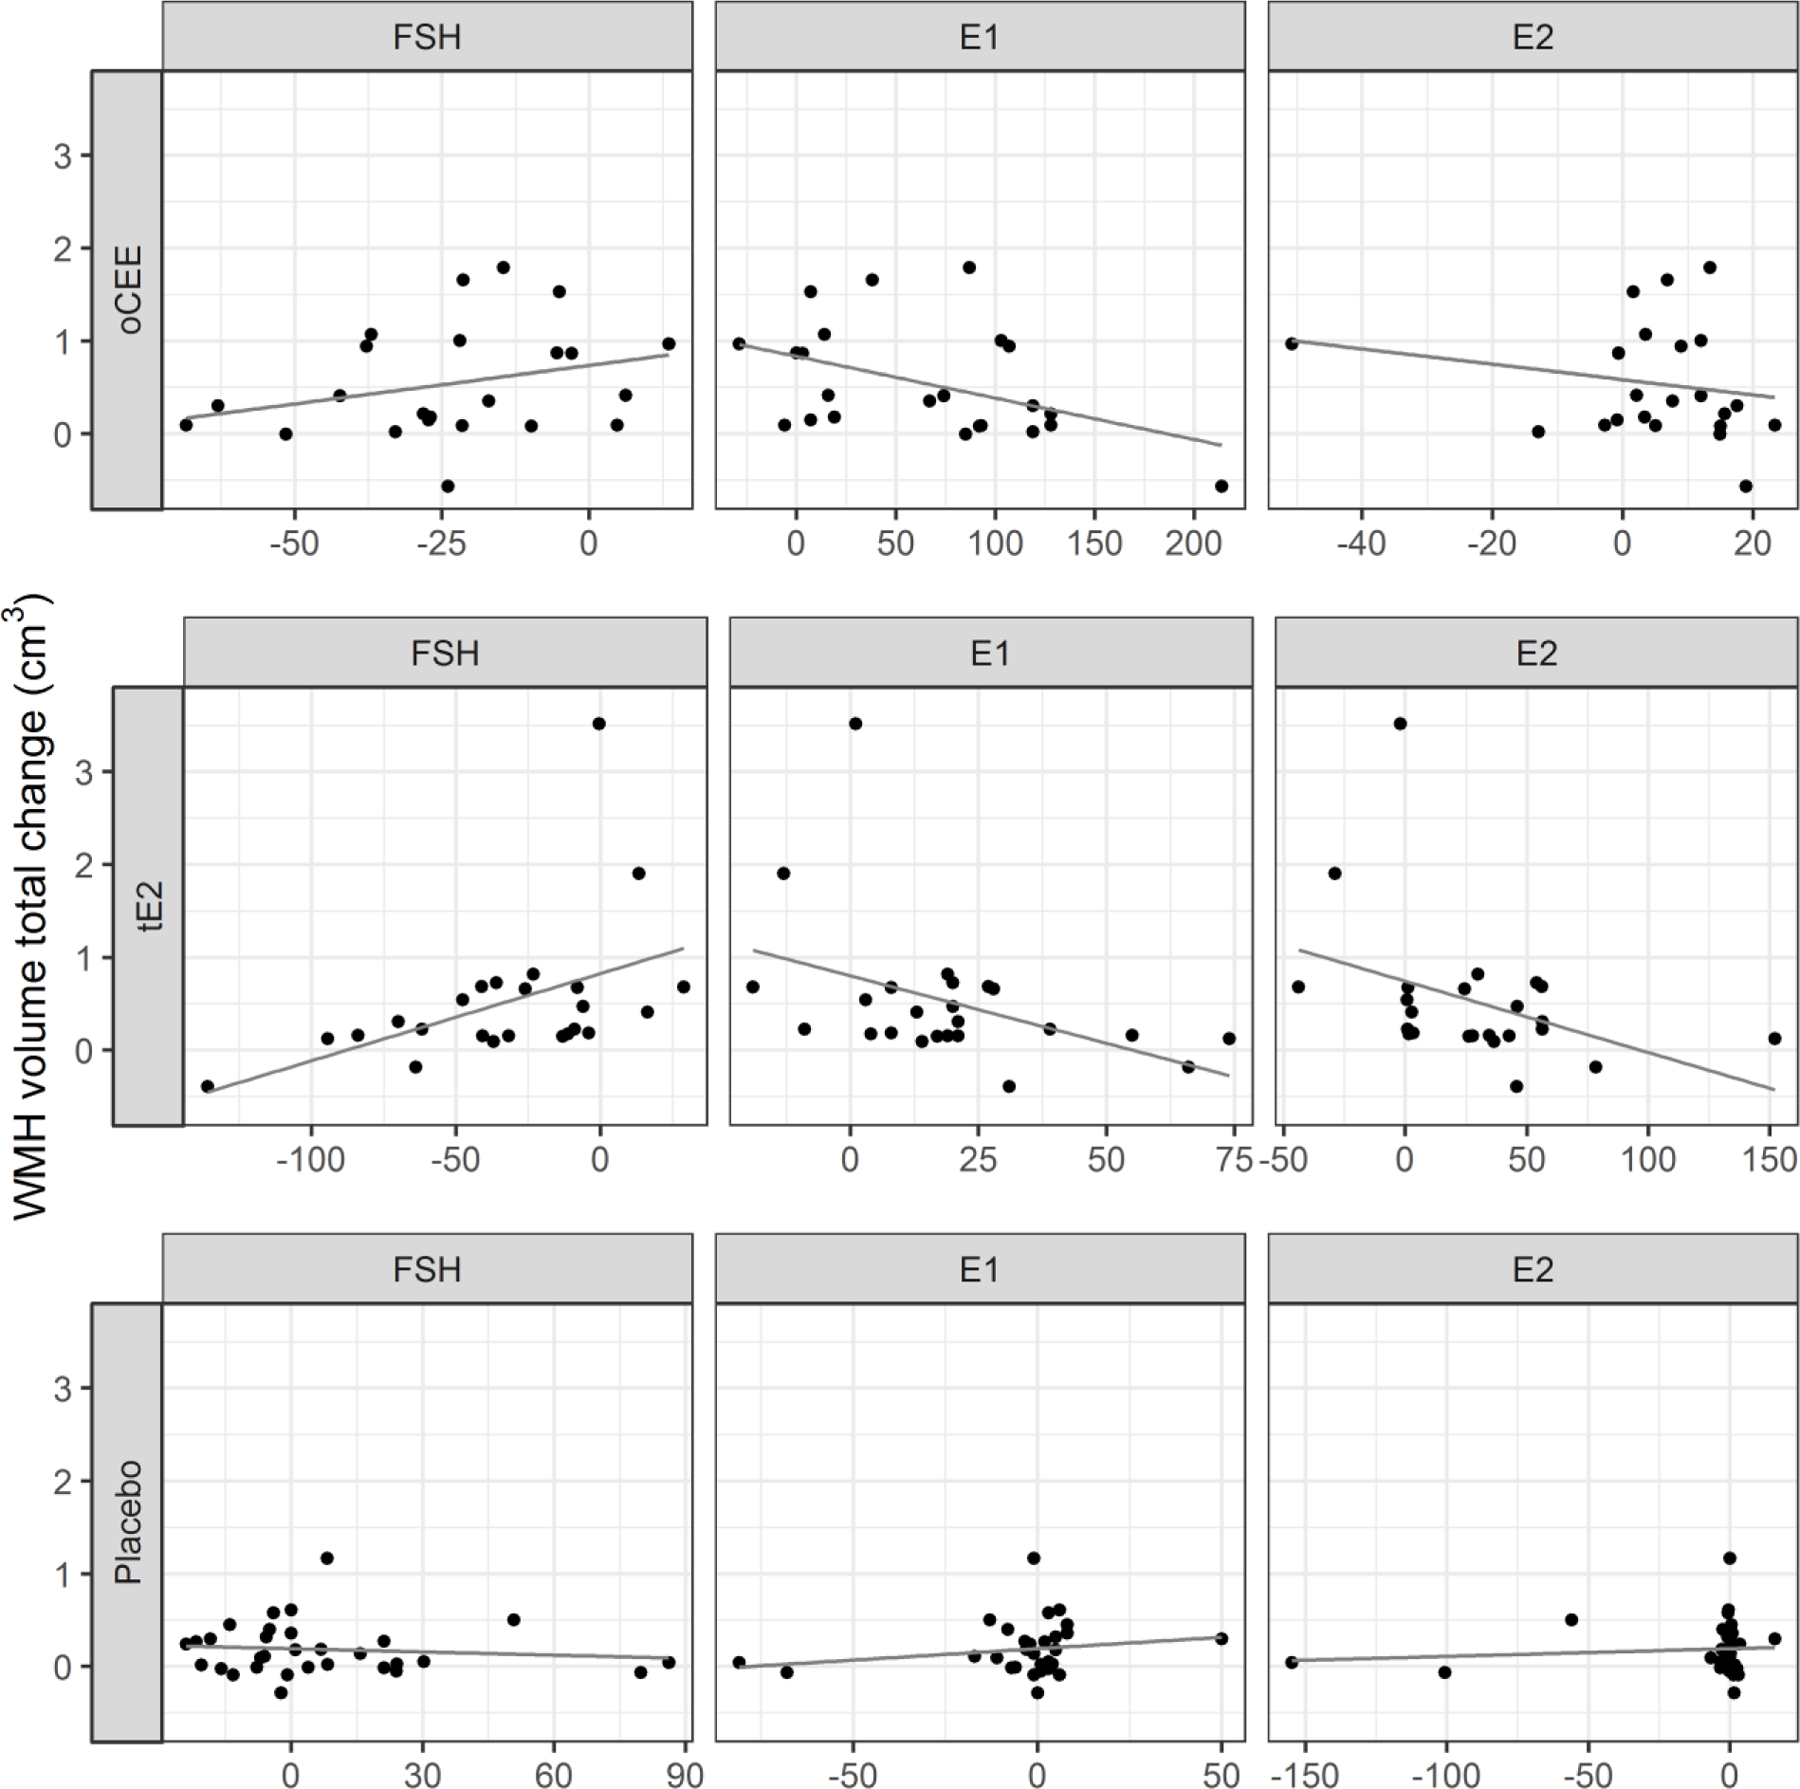
FIG. 2.

Scatterplots between total change in WMH volume and total changes in hormones levels by treatment group. The line represents the predicted linear relationship between the change in hormone and change in WMH. Each point represents a participant. E1, estrone; E2, estradiol, FSH, follicle-stimulating hormone; oCEE, oral conjugated equine estrogen; tE2, transdermal estradiol; WMH, white matter hyperintensity
