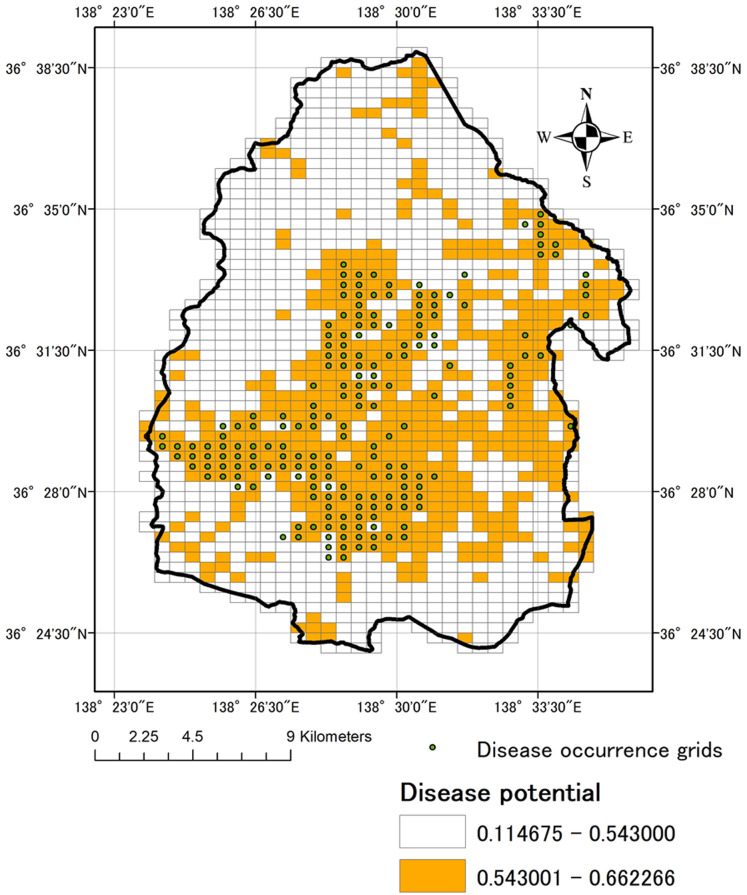
Figure 4. Disease occurrence grids and Distribution of occurrence probability of Verticillium wilt.
Each grid cell is 500 × 500 m. The occurrence probability in each grid was calculated based on disease occurrence data and Three explanatory variables (road density, elevation and topological wetness index) using by MaxEnt Ver. 3.3.3k (downloaded at https://www.cs.princeton.edu/~schapire/maxent/).

