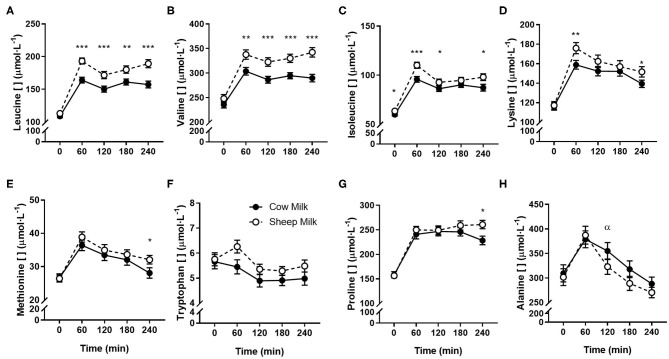
Figure 2.
Postprandial changes in plasma amino acids differing between sheep and cow milk following ingestion. Values presented as means ± SEM for leucine (A), valine (B), isoleucine (C), lysine (D), methionine (E), tryptophan (F), proline (G), and alanine (H). There was a main effect of milk for tryptophan (p = 0.012) and a time × milk interaction for all other presented amino acids (p < 0.05 each, respectively). *p < 0.05, **p < 0.01, ***p < 0.001 denote statistical significance between sheep (◦) and cow (•) milk; α denotes significant changes from baseline after cow milk (Sidak corrected post hocs).

