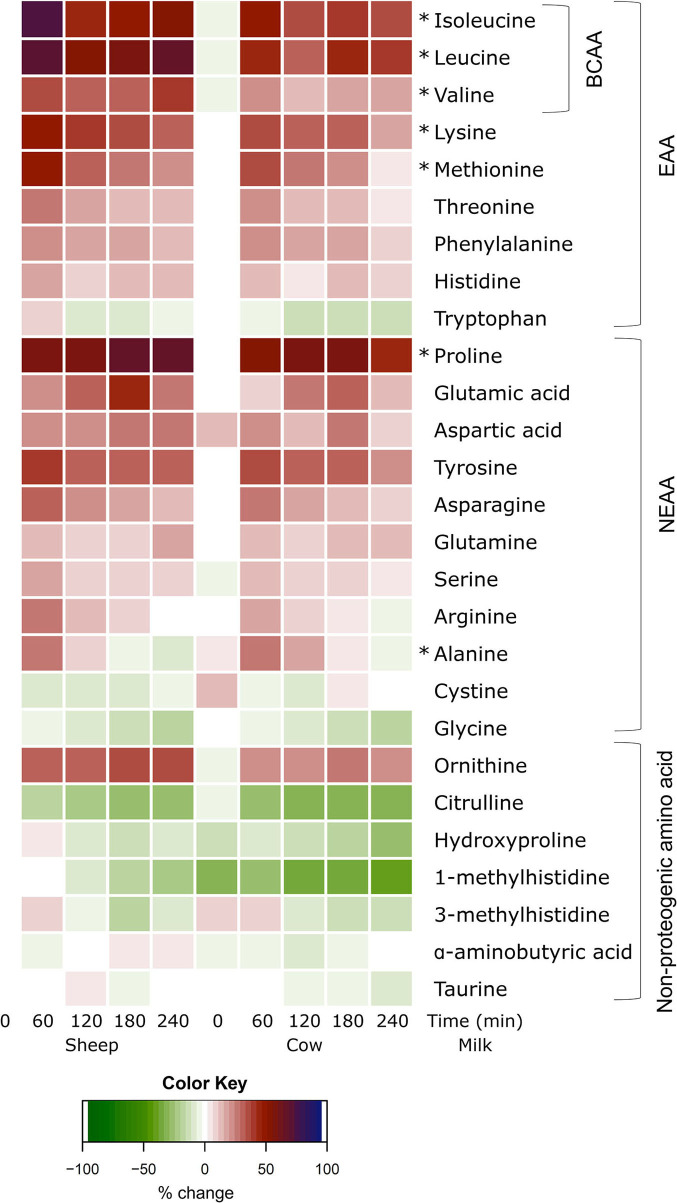
Figure 3.
Heat map of postprandial changes in individual plasma amino acids after sheep and cow milk ingestion. Values are presented as mean percent changes relative to concentrations at fasting prior to sheep milk ingestion. White represents a 0% change from sheep milk fasting concentrations. Red represents a 50% increase; blue represents a 100% increase; green represents a decrease. “0”: timepoint 0 min; “60”: timepoint 60 min; “120”: timepoint 120 min; “180”: timepoint 180 min; “240”: timepoint 240 min. Amino acids are grouped descending from the top by branched-chain amino acids (BCAA), essential amino acids (EAA), non-essential amino acids (NEAA), and non-proteogenic amino acids. *denotes significant (p < 0.05) interaction of time × milk.

