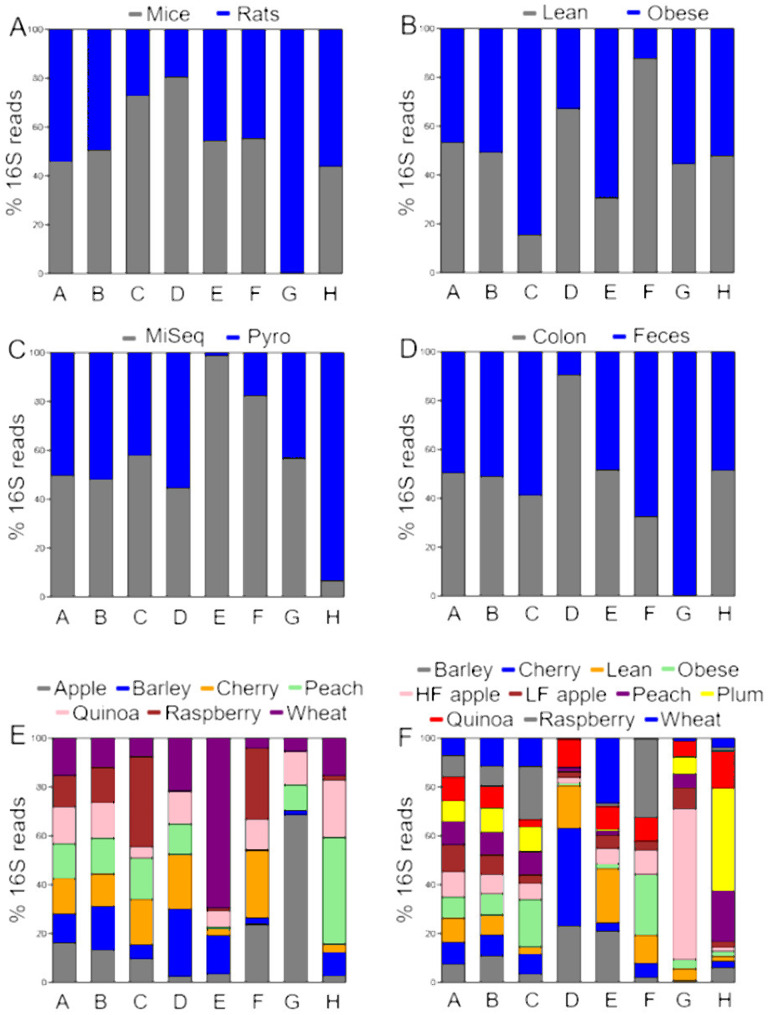
Figure 1. Proportions of relative abundances (percentages) of 16S reads.
The data is shown accordingly to the factors (A) animal model, (B) obesity status, (C) sequencing, (D) anatomical site, (E) study, and (F) treatment. Letters in bars represent different taxa (A: Firmicutes, B: Bacteroidetes, C: Proteobacteria, D: Verrucomicrobia, E: Deferribacteres, F: Actinobacteria, G: Cyanobacteria, and H: others). The bars do not represent the relative abundance of each taxon; instead, they show the proportion of 16S relative abundances from each level of the factors investigated. A balanced stacked bar denotes that the taxon was equally represented in each level of the factor (e.g., Firmicutes and Bacteroidetes between levels of all factors). An unbalanced stacked bar denotes that the taxon was more or less represented between the levels of the factor, for example Cyanobacteria between mice and rats, or between colon and feces.

